. 2007 May 1;92(9):3195-206.
doi: 10.1529/biophysj.106.095406. Epub 2007 Feb 9.

Effects of thin and thick filament proteins on calcium binding and exchange with cardiac troponin C

Affiliations

Effects of thin and thick filament proteins on calcium binding and exchange with cardiac troponin C

Jonathan P Davis et al. Biophys J. .

Abstract

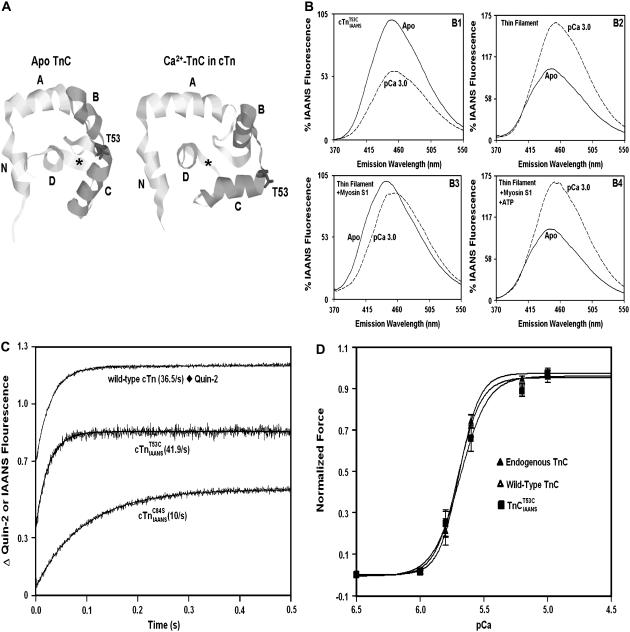
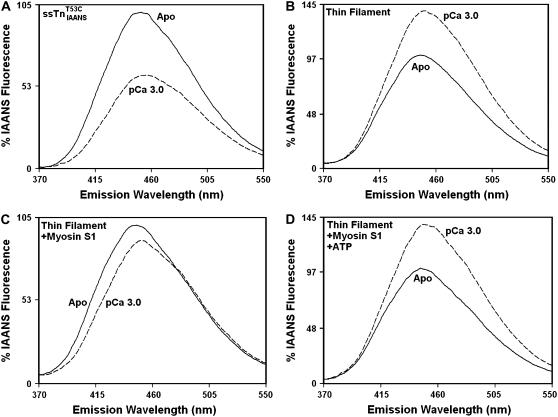
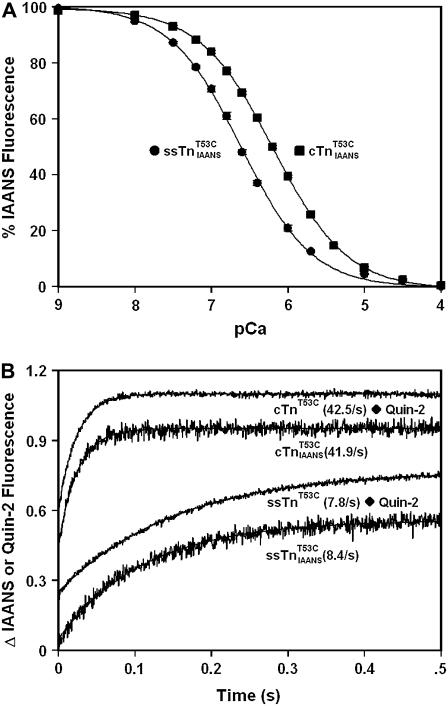
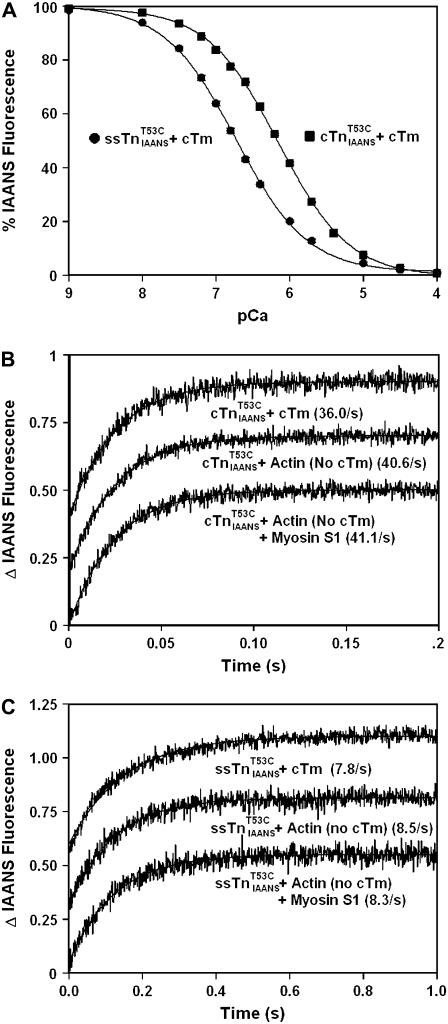
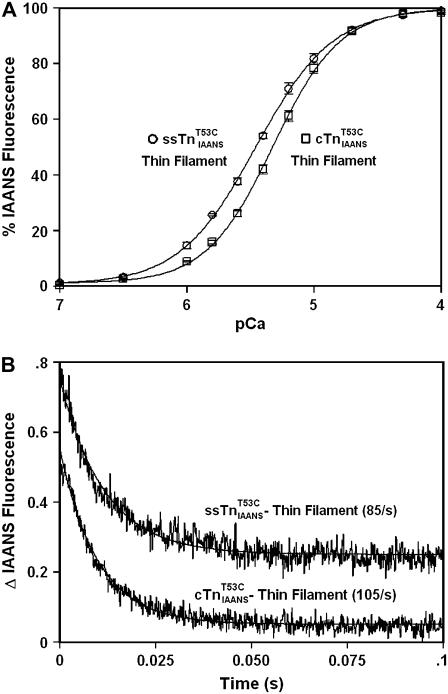
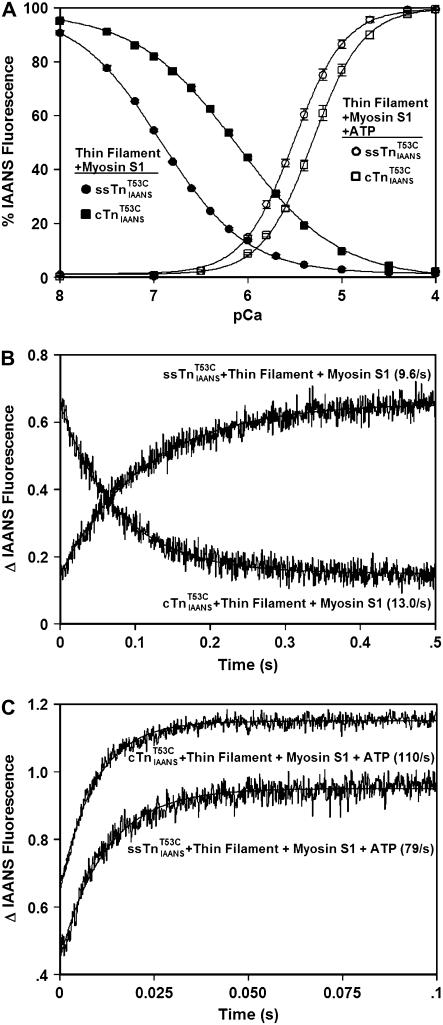
Understanding the effects of thin and thick filament proteins on the kinetics of Ca(2+) exchange with cardiac troponin C is essential to elucidating the Ca(2+)-dependent mechanisms controlling cardiac muscle contraction and relaxation. Unlike labeling of the endogenous Cys-84, labeling of cardiac troponin C at a novel engineered Cys-53 with 2-(4'-iodoacetamidoanilo)napthalene-6-sulfonic acid allowed us to accurately measure the rate of calcium dissociation from the regulatory domain of troponin C upon incorporation into the troponin complex. Neither tropomyosin nor actin alone affected the Ca(2+) binding properties of the troponin complex. However, addition of actin-tropomyosin to the troponin complex decreased the Ca(2+) sensitivity ( approximately 7.4-fold) and accelerated the rate of Ca(2+) dissociation from the regulatory domain of troponin C ( approximately 2.5-fold). Subsequent addition of myosin S1 to the reconstituted thin filaments (actin-tropomyosin-troponin) increased the Ca(2+) sensitivity ( approximately 6.2-fold) and decreased the rate of Ca(2+) dissociation from the regulatory domain of troponin C ( approximately 8.1-fold), which was completely reversed by ATP. Consistent with physiological data, replacement of cardiac troponin I with slow skeletal troponin I led to higher Ca(2+) sensitivities and slower Ca(2+) dissociation rates from troponin C in all the systems studied. Thus, both thin and thick filament proteins influence the ability of cardiac troponin C to sense and respond to Ca(2+). These results imply that both cross-bridge kinetics and Ca(2+) dissociation from troponin C work together to modulate the rate of cardiac muscle relaxation.


Figures

FIGURE 1
FIGURE 1
formula image behaves biochemically and physiologically similar to wild-type and endogenous cTnC. Panel A shows a ribbon representation of the regulatory domain of cTnC in the apo state (1SPY (53)) and in Ca2+ saturated cTn (1J1E; TnI, and TnT have been omitted for clarity (31)) utilizing the software Rasmol (54). The regulatory domain of cTnC contains five helices denoted as N, A, B, C, and D. As shown in panel A, helices B and C (BC subdomain) move away from the N, A, and D helices (NAD subdomain) upon Ca2+ and TnI binding. The D-helix is pointing out of the page, with the NAD subdomain colored light gray, the BC subdomain colored dark gray, and the Ca2+ binding loop indicated by an asterisk (*). Thr-53 is depicted in a stick representation. Panel B shows the IAANS emission spectra of the apo state (solid line) and Ca2+ saturated state (dashed line, pCa 3.0) for formula image in the cTn complex (B1), in reconstituted thin filaments (B2), plus myosin S1 (B3), and plus ATP (B4). The emission fluorescence of the spectra was calculated relative to the peak fluorescence of each respective apo state, which was considered 100%. Panel C shows the time course of Ca2+ dissociation from wild-type cTn directly followed by an increase in quin-2 fluorescence. Panel C also shows the EGTA-induced time courses of Ca2+ dissociation from formula image and formula image reported by an increase in IAANS fluorescence. Overlaid with the kinetic traces are the fitted exponential curves to the data (smooth curves, which may be difficult to discern). Panel D shows the Ca2+-dependent increase in force development in skinned rat trabeculae containing endogenous cTnC (▴), wild-type cTnC (▵), and formula image(▪).
FIGURE 2
FIGURE 2
Effects of ssTnI on the IAANS emission spectra of formula image in systems of increasing complexity. Panels AD show the IAANS emission spectra of the apo state (solid line) and Ca2+-saturated state (dashed line, pCa 3.0) for formula image in the ssTn complex (A), in reconstituted thin filaments (B), plus myosin S1 (C), and plus ATP (D). The emission fluorescence of the spectra was calculated relative to the peak fluorescence of each respective apo state, which was considered 100%.
FIGURE 3
FIGURE 3
Ca2+ sensitivities and dissociation rates from formula image and formula image Panel A shows the Ca2+-dependent decrease in IAANS fluorescence of formula image (▪) and formula image (•). Panel B shows the time courses of Ca2+ dissociation from unlabeled cTnT53C and ssTnT53C directly followed by an increase in quin-2 fluorescence. Panel B also shows the EGTA-induced time courses of Ca2+ dissociation from formula image and formula image reported by an increase in IAANS fluorescence.
FIGURE 4
FIGURE 4
Ca2+ binding properties and Ca2+ dissociation rates from the Tn complexes in the presence of cTm, or actin ± myosin S1 without cTm. Panel A shows the Ca2+-dependent decrease in IAANS fluorescence of formula image (▪) and formula image (•) in the presence of cTm. Panel B shows the EGTA-induced time courses of Ca2+ dissociation from formula image (0.3 μM) in the presence of cTm (0.9 μM) or actin (4 μM) ± myosin S1 (0.57 μM) reported by an increase in IAANS fluorescence. Panel C shows the EGTA-induced time courses of Ca2+ dissociation from formula image (0.3 μM) in the presence of cTm (0.9 μM) or actin (4 μM) ± myosin S1 (0.57 μM) reported by an increase in IAANS fluorescence. Increasing the concentration of formula image or formula imageto 0.5 μM did not alter the results (data not shown).
FIGURE 5
FIGURE 5
Ca2+ sensitivities and dissociation rates from formula image and formula image reconstituted thin filaments. Panel A shows the Ca2+-dependent increase in IAANS fluorescence of formula image (□) and formula image (○) reconstituted thin filaments. Panel B shows the EGTA-induced time courses of Ca2+ dissociation from formula image and formula image reconstituted thin filaments reported by a decrease in IAANS fluorescence.
FIGURE 6
FIGURE 6
Effects of myosin S1 on the Ca2+ sensitivities and dissociation rates from formula image and formula image reconstituted thin filaments. Panel A shows the Ca2+-dependent decrease in IAANS fluorescence of formula image (▪) and formula image (•) reconstituted thin filaments in the presence of myosin S1. Panel A also shows the Ca2+-dependent increase in IAANS fluorescence of formula image (□) and formula image (○) reconstituted thin filaments in the presence of myosin S1 and ATP. Panel B shows the EGTA-induced time courses of Ca2+ dissociation from formula image and formula image reconstituted thin filaments in the presence of myosin S1 reported by changes in IAANS fluorescence. The EGTA-induced decrease in formula image fluorescence as opposed to the increase in formula image fluorescence is due to the different emission filters used to capture the signals. Panel C shows the EGTA-induced time courses of Ca2+ dissociation from formula image and formula image reconstituted thin filaments in the presence of myosin S1 and ATP reported by an increase in IAANS fluorescence.

Similar articles

Cited by

References

    1. Kobayashi, T., and R. J. Solaro. 2005. Calcium, thin filaments, and the integrative biology of cardiac contractility. Annu. Rev. Physiol. 67:39–67. - PubMed
    1. Gordon, A. M., E. Homsher, and M. Regnier. 2000. Regulation of contraction in striated muscle. Physiol. Rev. 80:853–924. - PubMed
    1. Tikunova, S. B., J. A. Rall, and J. P. Davis. 2002. Effect of hydrophobic residue substitutions with glutamine on Ca(2+) binding and exchange with the N-domain of troponin C. Biochemistry. 41:6697–6705. - PubMed
    1. Dong, W. J., J. M. Robinson, J. Xing, and H. C. Cheung. 2003. Kinetics of conformational transitions in cardiac troponin induced by Ca2+ dissociation determined by Forster resonance energy transfer. J. Biol. Chem. 278:42394–42402. - PubMed
    1. Johnson, J. D., J. H. Collins, S. P. Robertson, and J. D. Potter. 1980. A fluorescent probe study of Ca2+ binding to the Ca2+-specific sites of cardiac troponin and troponin C. J. Biol. Chem. 255:9635–9640. - PubMed

Publication types