Second harmonic and sum frequency generation imaging of fibrous astroglial filaments in ex vivo spinal tissues
- PMID: 17293404
- PMCID: PMC1852339
- DOI: 10.1529/biophysj.106.089011
Second harmonic and sum frequency generation imaging of fibrous astroglial filaments in ex vivo spinal tissues
Abstract
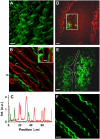
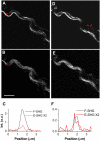
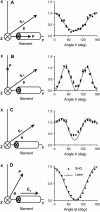
Sum frequency generation (SFG) and second harmonic generation (SHG) were observed from helical fibrils in spinal cord white matter isolated from guinea pigs. By combining SFG with coherent anti-Stokes Raman scattering microscopy, which allows visualization of myelinated axons, these fibers were found to be distributed near the surface of the spinal cord, between adjacent axons, and along the blood vessels. Using 20-microm-thick tissue slices, the ratio of forward to backward SHG signal from large bundles was found to be much larger than that from small single fibrils, indicating a phase-matching effect in coherent microscopy. Based on the intensity profiles across fibrils and the size dependence of forward and backward signal from the same fibril, we concluded that the main SHG signal directly originates from the fibrils, but not from surface SHG effects. Further polarization analysis of the SHG signal showed that the symmetry property of the fibril could be well described with a cylindrical model. Colocalization of the SHG signal with two-photon excitation fluorescence (TPEF) from the immunostaining of glial fibrillary acidic protein demonstrated that SHG arises from astroglial filaments. This assignment was further supported by colocalization of the SHG contrast with TPEF signals from astrocyte processes labeled by a Ca(2+) indicator and sulforhodamine 101. This work shows that a combination of three nonlinear optical imaging techniques--coherent anti-Stokes Raman scattering, TPEF, and SHG (SFG) microscopy--allows simultaneous visualization of different structures in a complex biological system.
Figures


Similar articles
-
Applications of second harmonic generation (SHG)/sum-frequency generation (SFG) imaging for biophysical characterization of the plasma membrane.Biophys Rev. 2020 Oct 27;12(6):1321-9. doi: 10.1007/s12551-020-00768-4. Online ahead of print. Biophys Rev. 2020. PMID: 33108561 Free PMC article. Review.
-
Imaging cells and extracellular matrix in vivo by using second-harmonic generation and two-photon excited fluorescence.Proc Natl Acad Sci U S A. 2002 Aug 20;99(17):11014-9. doi: 10.1073/pnas.172368799. Epub 2002 Aug 12. Proc Natl Acad Sci U S A. 2002. PMID: 12177437 Free PMC article.
-
Phase matching of backward second harmonic generation assisted by lattice structure in collagen tissues.J Biomed Opt. 2015 Oct;20(10):105011. doi: 10.1117/1.JBO.20.10.105011. J Biomed Opt. 2015. PMID: 26502229
-
Interpreting second-harmonic generation images of collagen I fibrils.Biophys J. 2005 Feb;88(2):1377-86. doi: 10.1529/biophysj.104.047308. Epub 2004 Nov 8. Biophys J. 2005. PMID: 15533922 Free PMC article.
-
Three-dimensional (3D) backward and forward second harmonic generation (SHG) microscopy of biological tissues.J Biophotonics. 2008 Dec;1(6):443-50. doi: 10.1002/jbio.200810060. J Biophotonics. 2008. PMID: 19343670 Review.
Cited by
-
Commercially derived versatile optical architecture for two-photon STED, wavelength mixing and label-free microscopy.Biomed Opt Express. 2022 Feb 14;13(3):1410-1429. doi: 10.1364/BOE.444525. eCollection 2022 Mar 1. Biomed Opt Express. 2022. PMID: 35414982 Free PMC article.
-
Sum frequency vibrational spectroscopy: the molecular origins of the optical second-order nonlinearity of collagen.Biophys J. 2007 Dec 15;93(12):4433-44. doi: 10.1529/biophysj.107.111047. Epub 2007 Aug 31. Biophys J. 2007. PMID: 17766339 Free PMC article.
-
Microfluidic CARS cytometry.Opt Express. 2008 Apr 14;16(8):5782-9. doi: 10.1364/oe.16.005782. Opt Express. 2008. PMID: 18542688 Free PMC article.
-
Applications of second harmonic generation (SHG)/sum-frequency generation (SFG) imaging for biophysical characterization of the plasma membrane.Biophys Rev. 2020 Oct 27;12(6):1321-9. doi: 10.1007/s12551-020-00768-4. Online ahead of print. Biophys Rev. 2020. PMID: 33108561 Free PMC article. Review.
-
Multimodal Nonlinear Optical Microscopy and Applications to Central Nervous System Imaging.IEEE J Sel Top Quantum Electron. 2008 Jan 1;14(1):4-9. doi: 10.1109/JSTQE.2007.913419. IEEE J Sel Top Quantum Electron. 2008. PMID: 19829746 Free PMC article.
References
-
- Fedoroff, S., and A. Vernadakis. 1986. Astrocytes. Academic Press, Orlando, FL.
-
- Raine, C. S. 1999. Neurocellular anatomy. In Basic Neurochemistry: Molecular, Cellular, and Medical Aspects. G. J. Siegel, B. W. Agranoff, R. W. Albers, S. K. Fisher, and M. D. Uhler, editors. 6th ed. Lippincott Williams & Wilkins, Philadelphia. 3–30.
-
- Eng, L. F., and Y. L. Lee. 1995. Intermediate filaments in astrocytes. In Neuroglia. H. Kettermann and B. R. Ransom, editors. Oxford University Press, New York. 650–667.
-
- Pekny, M., and M. Pekna. 2004. Astrocyte intermediate filaments in CNS pathologies and regeneration. J. Pathol. 204:428–437. - PubMed
-
- Deck, J. H. N., L. F. Eng, J. Bigbee, and S. M. Woodcock. 1978. The role of glial fibrillary acidic protein in the diagnosis of central nervous system tumors. Acta Neuropathol. (Berl.). 42:183–190. - PubMed
MeSH terms
Grants and funding
LinkOut - more resources
Full Text Sources
Other Literature Sources
Miscellaneous

