. 2007 Feb 20;104(8):2685-90.
doi: 10.1073/pnas.0608794104. Epub 2007 Feb 9.

Exploring the proton pump mechanism of cytochrome c oxidase in real time

Affiliations

Exploring the proton pump mechanism of cytochrome c oxidase in real time

Ilya Belevich et al. Proc Natl Acad Sci U S A. .

Abstract

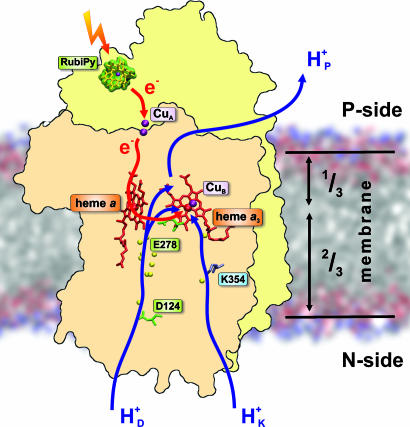
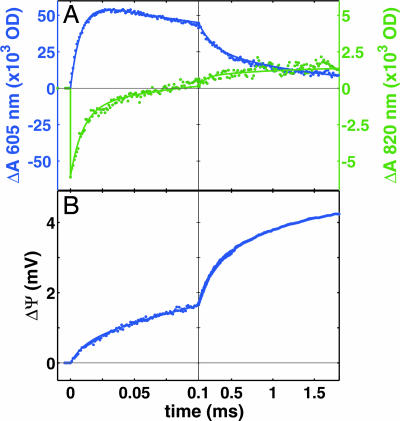
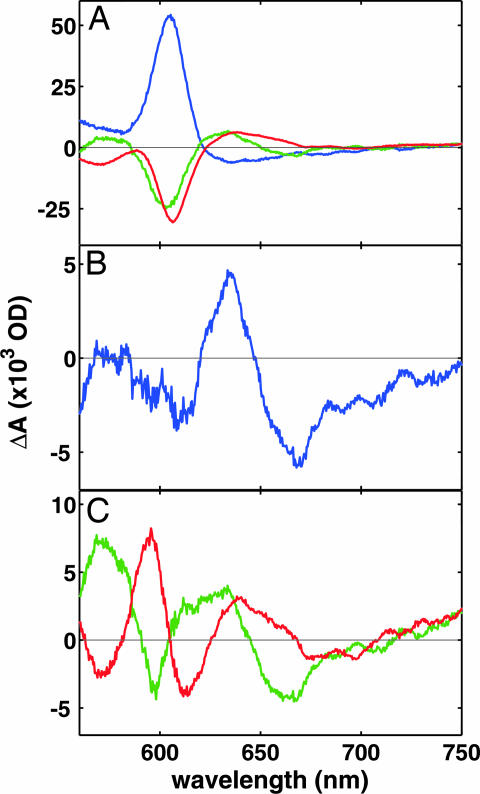
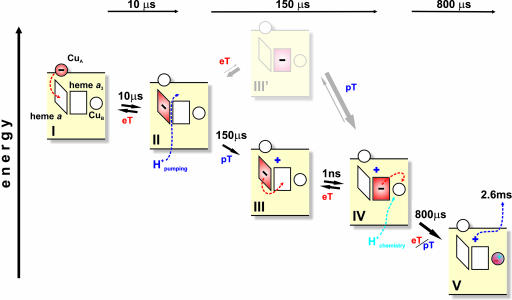
Cytochrome c oxidase catalyzes most of the biological oxygen consumption on Earth, a process responsible for energy supply in aerobic organisms. This remarkable membrane-bound enzyme also converts free energy from O(2) reduction to an electrochemical proton gradient by functioning as a redox-linked proton pump. Although the structures of several oxidases are known, the molecular mechanism of redox-linked proton translocation has remained elusive. Here, correlated internal electron and proton transfer reactions were tracked in real time by spectroscopic and electrometric techniques after laser-activated electron injection into the oxidized enzyme. The observed kinetics establish the long-sought reaction sequence of the proton pump mechanism and describe some of its thermodynamic properties. The 10-micros electron transfer to heme a raises the pK(a) of a "pump site," which is loaded by a proton from the inside of the membrane in 150 micros. This loading increases the redox potentials of both hemes a and a(3), which allows electron equilibration between them at the same rate. Then, in 0.8 ms, another proton is transferred from the inside to the heme a(3)/Cu(B) center, and the electron is transferred to Cu(B). Finally, in 2.6 ms, the preloaded proton is released from the pump site to the opposite side of the membrane.


Conflict of interest statement

The authors declare no conflict of interest.

Figures

Fig. 1.
Fig. 1.
CcO structure and function. The two key subunits, I (pink) and II (yellow), are depicted in the membrane together with the four redox-active centers, CuA, heme a, heme a3, and CuB. In this work, the reaction is initiated by photoinduced electron injection from ruthenium bispyridyl (RubiPy). The electron transfer path is indicated in red. Proton transfer from the N-side of the membrane takes place via two pathways, D and K (blue arrows; see text). The pumped proton is released to the P-side from an as-yet-unidentified pump site above heme a3. The figure was made with the help of the crystal structure with Protein Data Bank ID code 1v54 (37) and the program VMD (45).
Fig. 2.
Fig. 2.
Electron and proton transfer kinetics in CcO. (A) The redox kinetics of heme a (blue, reduction upwards) and CuA (green, reduction downwards). The best three-exponential fit (lines) to the data (dots) yields time constants of 10, 150, and 800 μs. (B) The corresponding kinetics of membrane potential formation in vesicles inlaid with CcO. The fit (blue line) to the data (blue dots) with time constants from the optical measurements (10, 150, and 800 μs) requires one more component with a time constant of 2.6 ms. The relative amplitudes of the four phases are 12%, 42%, 30%, and 16% of total. The laser is fired at zero time.
Fig. 3.
Fig. 3.
Absorption spectra of reaction phases. (A) Kinetic absorption spectra of the 10-μs (blue), 150-μs (green), and 800-μs (red) phases. (B) Difference spectrum between the final product of the reaction minus the state before the laser pulse. (C) Difference spectra of the 150-μs (green) and 800-μs (red) reaction phases from which the contribution of heme a oxidation (see A) has been subtracted.
Fig. 4.
Fig. 4.
Reaction scheme. The rhombus and square represent hemes a and a3, respectively. The circle above heme a represents the CuA site, and the circle next to heme a3 represents CuB. The minus sign denotes the position of the photoinjected electron. The dark and light blue plus signs denote the pumped and substrate protons, respectively. Dashed arrows indicate electron and proton transfers during the next reaction step. eT, electron transfer; pT, proton transfer.

Similar articles

Cited by

References

    1. Gennis RB. Front Biosci. 2004;9:581–591. - PubMed
    1. Michel H, Behr J, Harrenga A, Kannt A. Annu Rev Biophys Biomol Struct. 1998;27:329–356. - PubMed
    1. Bloch D, Belevich I, Jasaitis A, Ribacka C, Puustinen A, Verkhovsky MI, Wikström M. Proc Natl Acad Sci USA. 2004;101:529–533. - PMC - PubMed
    1. Mayo SL, Ellis WR, Jr, Crutchley RJ, Gray HB. Science. 1986;233:948–952. - PubMed
    1. Nilsson T. Proc Natl Acad Sci USA. 1992;89:6497–6501. - PMC - PubMed

Publication types

LinkOut - more resources