

Diabetes downregulates large-conductance Ca2+-activated potassium beta 1 channel subunit in retinal arteriolar smooth muscle
- PMID: 17293477
- PMCID: PMC2596350
- DOI: 10.1161/01.RES.0000260182.36481.c9
Diabetes downregulates large-conductance Ca2+-activated potassium beta 1 channel subunit in retinal arteriolar smooth muscle
Abstract
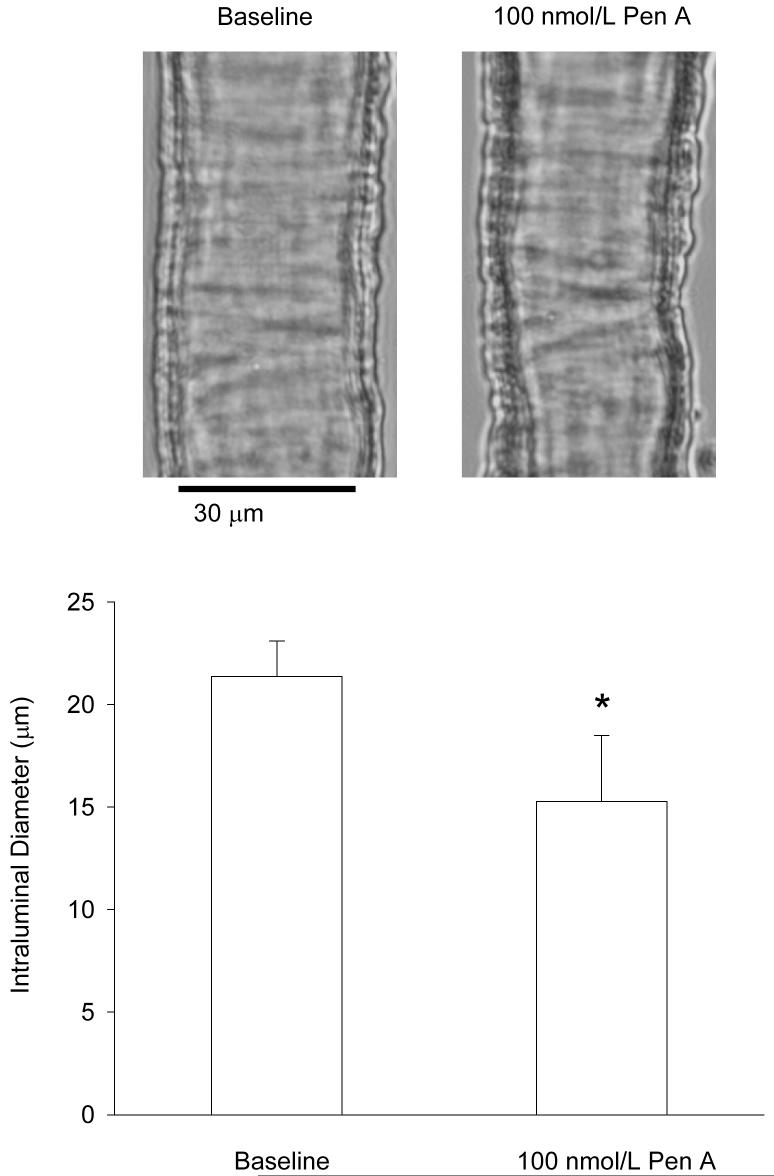
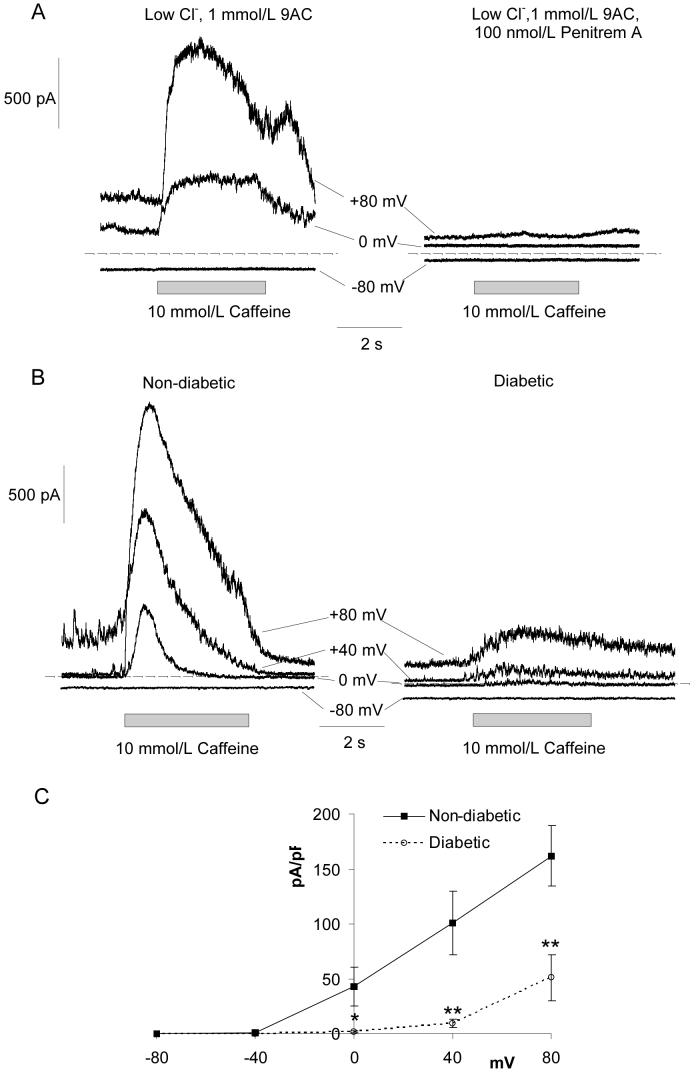
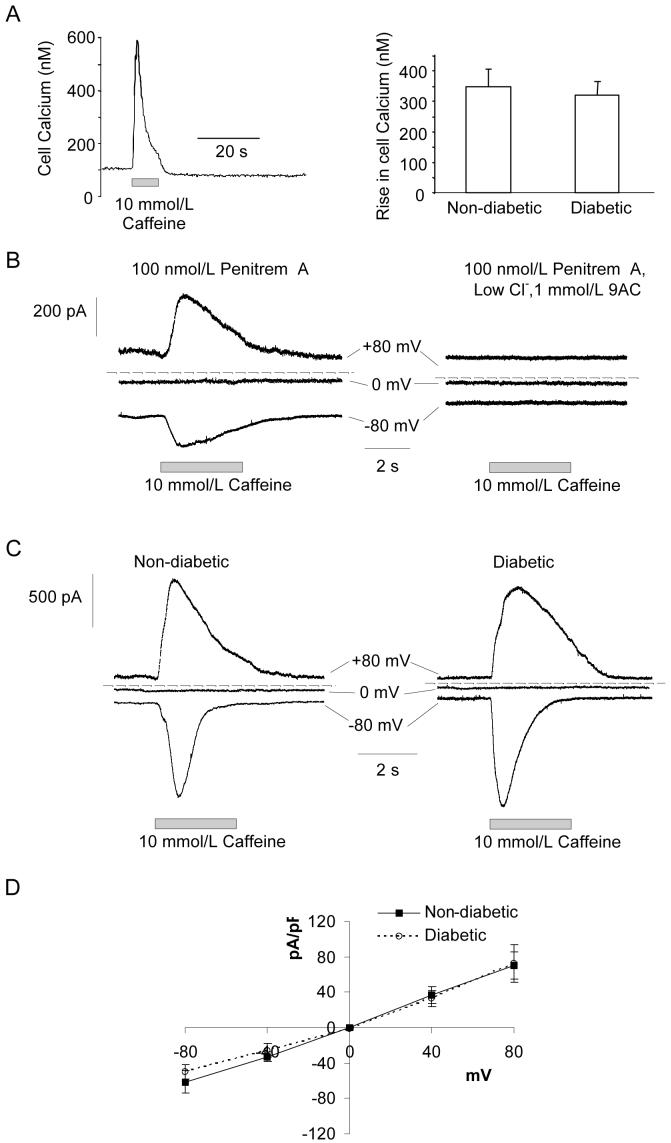
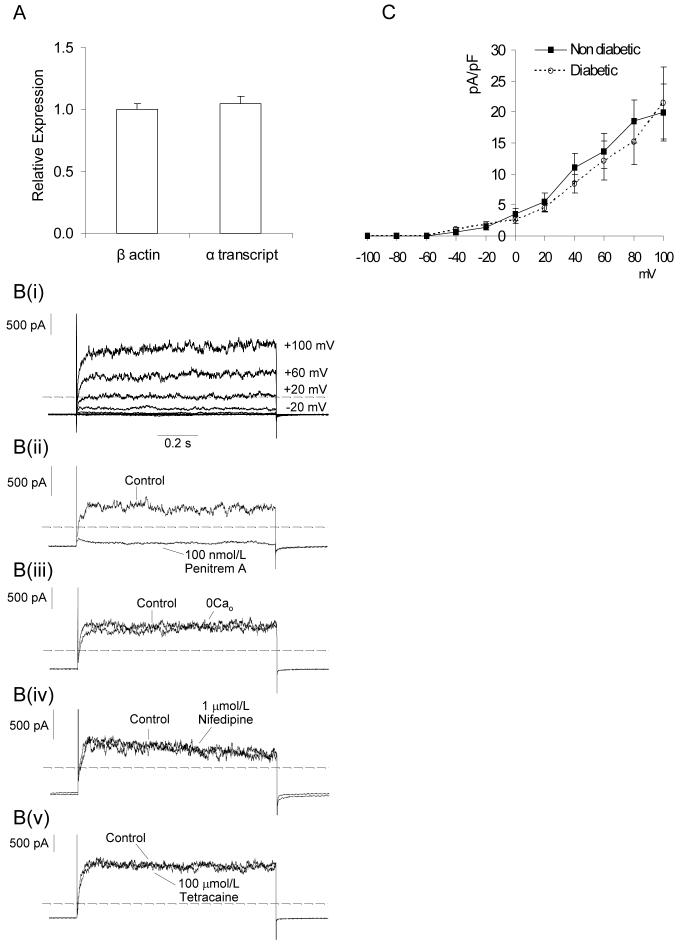
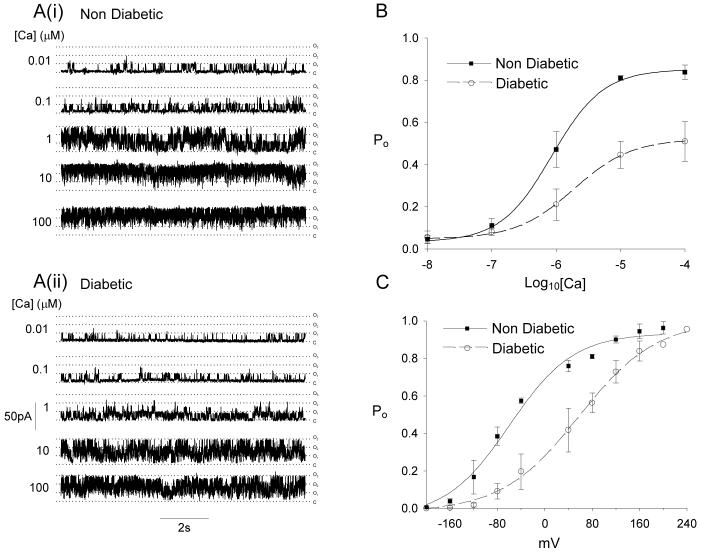
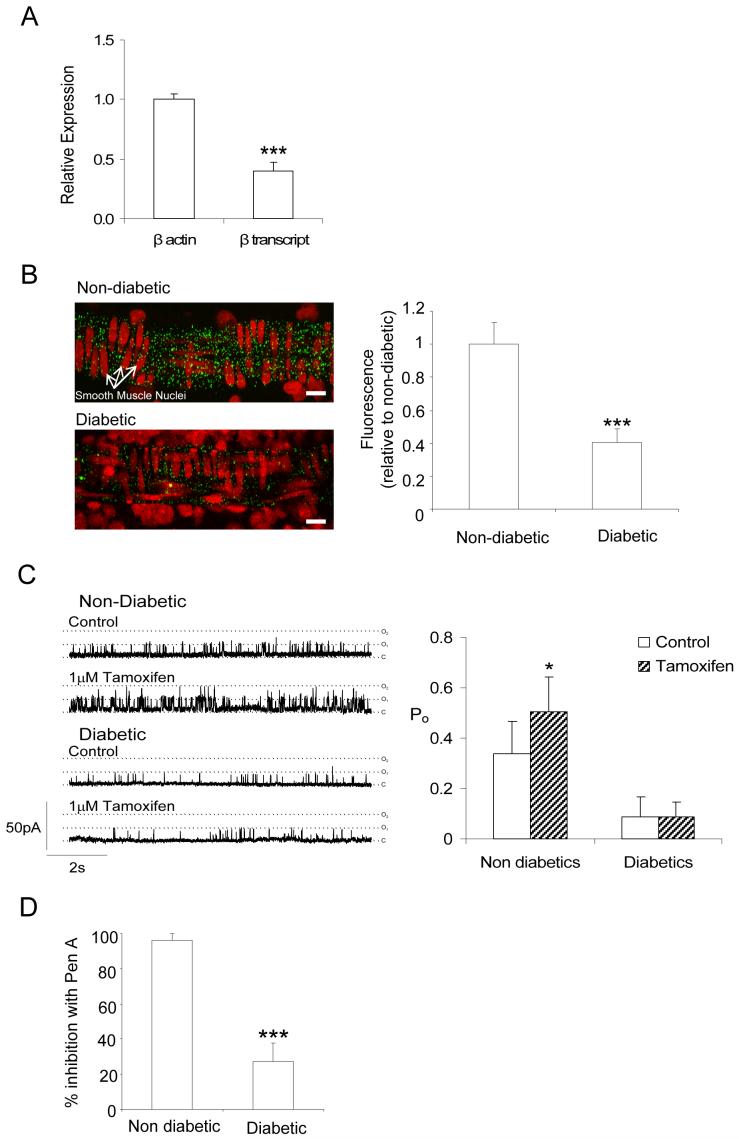
Retinal vasoconstriction and reduced retinal blood flow precede the onset of diabetic retinopathy. The pathophysiological mechanisms that underlie increased retinal arteriolar tone during diabetes remain unclear. Normally, local Ca(2+) release events (Ca(2+)-sparks), trigger the activation of large-conductance Ca(2+)-activated K(+)(BK)-channels which hyperpolarize and relax vascular smooth muscle cells, thereby causing vasodilatation. In the present study, we examined BK channel function in retinal vascular smooth muscle cells from streptozotocin-induced diabetic rats. The BK channel inhibitor, Penitrem A, constricted nondiabetic retinal arterioles (pressurized to 70mmHg) by 28%. The BK current evoked by caffeine was dramatically reduced in retinal arterioles from diabetic animals even though caffeine-evoked [Ca(2+)](i) release was unaffected. Spontaneous BK currents were smaller in diabetic cells, but the amplitude of Ca(2+)-sparks was larger. The amplitudes of BK currents elicited by depolarizing voltage steps were similar in control and diabetic arterioles and mRNA expression of the pore-forming BKalpha subunit was unchanged. The Ca(2+)-sensitivity of single BK channels from diabetic retinal vascular smooth muscle cells was markedly reduced. The BKbeta1 subunit confers Ca(2+)-sensitivity to BK channel complexes and both transcript and protein levels for BKbeta1 were appreciably lower in diabetic retinal arterioles. The mean open times and the sensitivity of BK channels to tamoxifen were decreased in diabetic cells, consistent with a downregulation of BKbeta1 subunits. The potency of blockade by Pen A was lower for BK channels from diabetic animals. Thus, changes in the molecular composition of BK channels could account for retinal hypoperfusion in early diabetes, an idea having wider implications for the pathogenesis of diabetic hypertension.
Figures

Similar articles
-
Selective downregulation of the BKbeta1 subunit in diabetic arteriolar myocytes.Channels (Austin). 2007 May-Jun;1(3):141-3. doi: 10.4161/chan.4596. Epub 2007 Jun 18. Channels (Austin). 2007. PMID: 18690028 Free PMC article.
-
Downregulation of BK channel function and protein expression in coronary arteriolar smooth muscle cells of type 2 diabetic patients.Cardiovasc Res. 2019 Jan 1;115(1):145-153. doi: 10.1093/cvr/cvy137. Cardiovasc Res. 2019. PMID: 29850792 Free PMC article.
-
Regulation of Coronary Arterial Large Conductance Ca2+-Activated K+ Channel Protein Expression and Function by n-3 Polyunsaturated Fatty Acids in Diabetic Rats.J Vasc Res. 2017;54(6):329-343. doi: 10.1159/000479870. Epub 2017 Oct 18. J Vasc Res. 2017. PMID: 29040972
-
Functional regulation of large conductance Ca2+-activated K+ channels in vascular diseases.Metabolism. 2018 Jun;83:75-80. doi: 10.1016/j.metabol.2018.01.008. Epub 2018 Jan 31. Metabolism. 2018. PMID: 29373813 Review.
-
Large conductance, Ca2+-activated K+ channels (BKCa) and arteriolar myogenic signaling.FEBS Lett. 2010 May 17;584(10):2033-42. doi: 10.1016/j.febslet.2010.02.045. Epub 2010 Feb 20. FEBS Lett. 2010. PMID: 20178789 Free PMC article. Review.
Cited by
-
Inhibition of big-conductance Ca2+-activated K+ channels in cerebral artery (vascular) smooth muscle cells is a major novel mechanism for tacrolimus-induced hypertension.Pflugers Arch. 2021 Jan;473(1):53-66. doi: 10.1007/s00424-020-02470-6. Epub 2020 Oct 8. Pflugers Arch. 2021. PMID: 33033891 Free PMC article.
-
Ca2+-activated Cl- current in retinal arteriolar smooth muscle.Invest Ophthalmol Vis Sci. 2009 Jan;50(1):364-71. doi: 10.1167/iovs.08-2524. Epub 2008 Sep 4. Invest Ophthalmol Vis Sci. 2009. PMID: 18775864 Free PMC article.
-
Impairment of brain mitochondrial charybdotoxin- and ATP-insensitive BK channel activities in diabetes.Neuromolecular Med. 2014 Dec;16(4):862-71. doi: 10.1007/s12017-014-8334-6. Epub 2014 Oct 26. Neuromolecular Med. 2014. PMID: 25344764
-
Innovative technology shows impact of glycaemic control on peripheral retinal vessels in adolescents with type 1 diabetes.Diabetologia. 2017 Oct;60(10):2103-2110. doi: 10.1007/s00125-017-4375-3. Epub 2017 Jul 15. Diabetologia. 2017. PMID: 28711971
-
Retinovascular physiology and pathophysiology: new experimental approach/new insights.Prog Retin Eye Res. 2012 May;31(3):258-70. doi: 10.1016/j.preteyeres.2012.01.001. Epub 2012 Feb 5. Prog Retin Eye Res. 2012. PMID: 22333041 Free PMC article. Review.
References
-
- Curtis TM, Scholfield CN. The role of lipids and protein kinase Cs in the pathogenesis of diabetic retinopathy. Diabetes Metab Res Rev. 2004;20(1):28–43. - PubMed
-
- The Diabetes Control and Complications Trial Research Group The effect of intensive treatment of diabetes on the development and progression of long-term complications in insulin-dependent diabetes mellitus. N Engl J Med. 1993;329(14):977–86. - PubMed
-
- UK Prospective Diabetes Study (UKPDS) Group Intensive blood-glucose control with sulphonylureas or insulin compared with conventional treatment and risk of complications in patients with type 2 diabetes (UKPDS 33) Lancet. 1998;352(9131):837–53. - PubMed
-
- Bursell SE, Clermont AC, Kinsley BT, Simonson DC, Aiello LM, Wolpert HA. Retinal blood flow changes in patients with insulin-dependent diabetes mellitus and no diabetic retinopathy. Invest Ophthalmol Vis Sci. 1996;37(5):886–97. - PubMed
-
- Clermont AC, Aiello LP, Mori F, Aiello LM, Bursell SE. Vascular endothelial growth factor and severity of nonproliferative diabetic retinopathy mediate retinal hemodynamics in vivo: a potential role for vascular endothelial growth factor in the progression of nonproliferative diabetic retinopathy. Am J Ophthalmol. 1997;124(4):433–46. - PubMed
Publication types
MeSH terms
Substances
Grants and funding
LinkOut - more resources
Full Text Sources
Miscellaneous
