

Induction of glutathione S-transferase in biofilms and germinating spores of Mucor hiemalis strain EH5 from cold sulfidic spring waters
- PMID: 17293503
- PMCID: PMC1855610
- DOI: 10.1128/AEM.02786-06
Induction of glutathione S-transferase in biofilms and germinating spores of Mucor hiemalis strain EH5 from cold sulfidic spring waters
Abstract
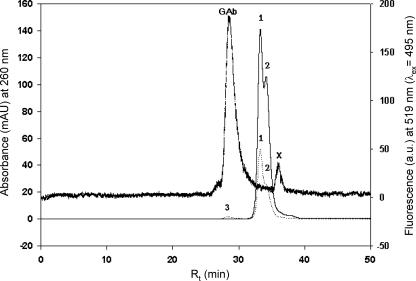
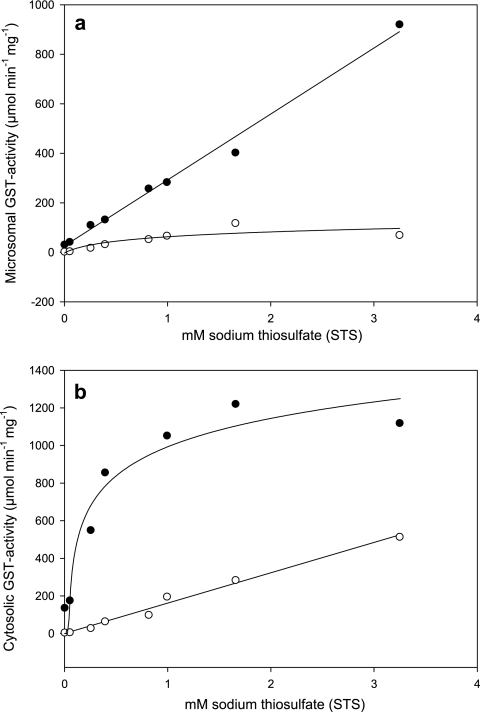
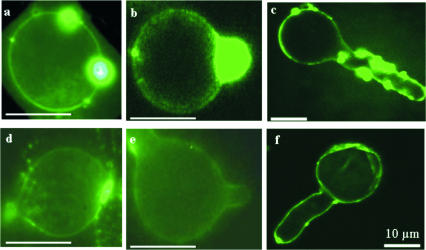
The occurrence and activation of glutathione S-transferase (GST) and the GST activities in biofilms in cold sulfidic spring waters were compared to the occurrence and activation of GST and the GST activities of the aquatic fungal strains EH5 and EH7 of Mucor hiemalis isolated for the first time from such waters. Using fluorescently labeled polyclonal anti-GST antibodies and GST activity measurements, we demonstrated that a high level of GST occurred in situ in natural biofilms and pure cultures of strain EH5. Measurement of microsomal and cytosolic soluble GST activities using different xenobiotic substrates, including 1-chloro-2,4-dinitrobenzene (CDNB), 1,2-dichloro-4-nitrobenzene, 1,2-epoxy-3-(4-nitrophenoxy)propane, 1-iodo-2,4-dinitrobenzene, and fluorodifen, showed that the overall biotransforming abilities of biofilms were at least sixfold greater than that of strain EH5 alone. Increasing the level of sodium thiosulfate (STS) in the medium stimulated the microsomal and cytosolic GST activities with CDNB of strain EH5 about 44- and 94-fold, respectively, compared to the activities in the control. The induction of microsomal GST activity with fluorodifen by STS was strongly linear, but the initial strong linear increase in cytosolic GST activity with fluorodifen showed saturation-like effects at STS concentrations higher than approximately 1 mM. Using laser scanning confocal and conventional fluorescence microscopy, abundant fluorescently labeled GST proteins were identified in germinating sporangiospores of strain EH5 after activation by STS. High-performance size exclusion chromatography and sodium dodecyl sulfate-polyacrylamide gel electrophoresis revealed the presence of at least two main GSTs ( approximately 27.8- and approximately 25.6-kDa subunits) in the cytosol of EH5, whereas the major 27.8-kDa subunit was the only GST in microsomes. We suggest that differential cellular GST expression takes place in strain EH5 depending on spore and hyphal development. Our results may contribute to our understanding of induction of GST by sulfurous compounds, as well as to the immunofluorescence visualization of GST in aquatic fungus and fungus-bacterium biofilms.
Figures
Similar articles
-
Glutathione S-transferases in the Japanese quail: tissue distribution and purification of the liver isozymes.J Biochem Toxicol. 1996;11(2):85-96. doi: 10.1002/(SICI)1522-7146(1996)11:2<85::AID-JBT6>3.0.CO;2-Q. J Biochem Toxicol. 1996. PMID: 8884469
-
Circadian variation of hepatic glutathione S-transferase activities in the mouse.Xenobiotica. 1999 Jan;29(1):43-51. doi: 10.1080/004982599238803. Xenobiotica. 1999. PMID: 10078839
-
Differential combined effect of cadmium and nickel on hepatic and renal glutathione S-transferases of the guinea pig.Environ Health Perspect. 1994 Nov;102 Suppl 9(Suppl 9):69-72. doi: 10.1289/ehp.94102s969. Environ Health Perspect. 1994. PMID: 7698089 Free PMC article.
-
Differential responses of hepatic monooxygenases and glutathione S-transferases of mice to a combination of cadmium and nickel.Comp Biochem Physiol C Pharmacol Toxicol Endocrinol. 1995 May;111(1):61-8. doi: 10.1016/0742-8413(95)00020-8. Comp Biochem Physiol C Pharmacol Toxicol Endocrinol. 1995. PMID: 7656185
-
Glutathione S-transferase in adult Dirofilaria immitis and Brugia pahangi.Mol Biochem Parasitol. 1986 Aug;20(2):199-206. doi: 10.1016/0166-6851(86)90032-0. Mol Biochem Parasitol. 1986. PMID: 3748071
Cited by
-
A new mercury-accumulating Mucor hiemalis strain EH8 from cold sulfidic spring water biofilms.Microbiologyopen. 2016 Oct;5(5):763-781. doi: 10.1002/mbo3.368. Epub 2016 May 13. Microbiologyopen. 2016. PMID: 27177603 Free PMC article.
-
Ecology, adaptation, and function of methane-sulfidic spring water biofilm microorganisms, including a strain of anaerobic fungus Mucor hiemalis.Microbiologyopen. 2017 Aug;6(4):e00483. doi: 10.1002/mbo3.483. Epub 2017 May 24. Microbiologyopen. 2017. PMID: 28544612 Free PMC article.
-
Multimetal bioremediation and biomining by a combination of new aquatic strains of Mucor hiemalis.Sci Rep. 2019 Jul 16;9(1):10318. doi: 10.1038/s41598-019-46560-7. Sci Rep. 2019. PMID: 31311950 Free PMC article.
-
Alternaria alternata and its allergens: a comprehensive review.Clin Rev Allergy Immunol. 2014 Dec;47(3):354-65. doi: 10.1007/s12016-014-8447-6. Clin Rev Allergy Immunol. 2014. PMID: 25205364 Review.
References
-
- Arjmand, M., and H. Sandermann, Jr. 1985. Mineralization of chloroaniline/lignin conjugates and of free chloroanilines by the white-rot fungus Phanerochaete chrysosporium. J. Agric. Food Chem. 33:1055-1060.
-
- Aßmus, B. 1996. In situ-Detektion von Bakterien aus Boden- und Gewässerhabitaten mit spezifischen Markierungen sowie optischen und zytometrischen Methoden. Ph.D. thesis. Faculty of Biology, Ludwig-Maximilians University, Munich, Germany.
-
- Bradford, M. M. 1976. A rapid and sensitive method for the quantification of microgram quantities of protein utilizing the principle of protein-dye binding. Anal. Biochem. 72:248-254. - PubMed
Publication types
MeSH terms
Substances
LinkOut - more resources
Full Text Sources
Other Literature Sources
Research Materials
