

Carbohydrate starvation causes a metabolically active but nonculturable state in Lactococcus lactis
- PMID: 17293521
- PMCID: PMC1855592
- DOI: 10.1128/AEM.01832-06
Carbohydrate starvation causes a metabolically active but nonculturable state in Lactococcus lactis
Abstract
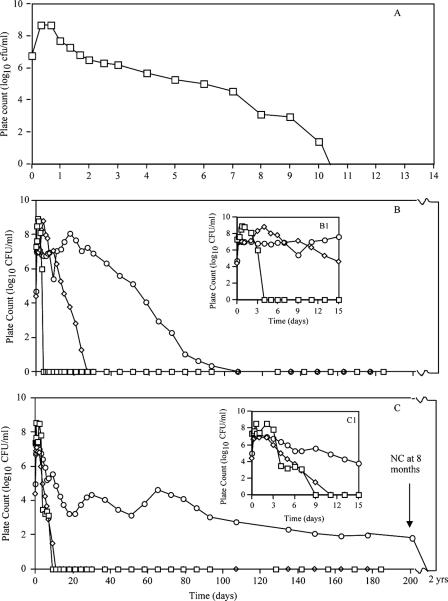
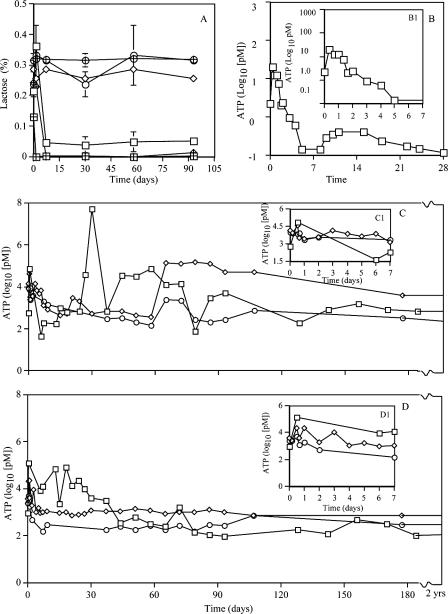
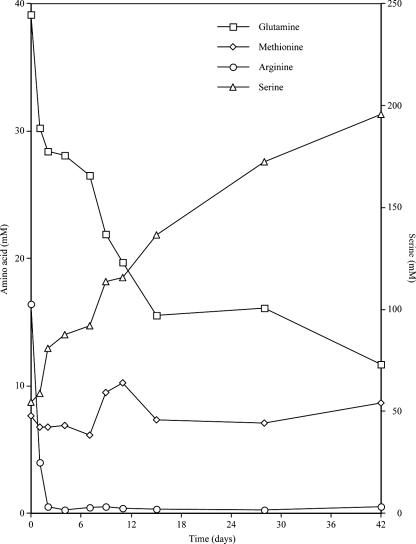
This study characterized the ability of lactococci to become nonculturable under carbohydrate starvation while maintaining metabolic activity. We determined the changes in physiological parameters and extracellular substrate levels of multiple lactococcal strains under a number of environmental conditions along with whole-genome expression profiles. Three distinct phases were observed, logarithmic growth, sugar exhaustion, and nonculturability. Shortly after carbohydrate starvation, each lactococcal strain lost the ability to form colonies on solid media but maintained an intact cell membrane and metabolic activity for over 3.5 years. ML3, a strain that metabolized lactose rapidly, reached nonculturability within 1 week. Strains that metabolized lactose slowly (SK11) or not at all (IL1403) required 1 to 3 months to become nonculturable. In all cases, the cells contained at least 100 pM of intracellular ATP after 6 months of starvation and remained at that level for the remainder of the study. Aminopeptidase and lipase/esterase activities decreased below detection limits during the nonculturable phase. During sugar exhaustion and entry into nonculturability, serine and methionine were produced, while glutamine and arginine were depleted from the medium. The cells retained the ability to transport amino acids via proton motive force and peptides via ATP-driven translocation. The addition of branched-chain amino acids to the culture medium resulted in increased intracellular ATP levels and new metabolic products, indicating that branched-chain amino acid catabolism resulted in energy and metabolic products to support survival during starvation. Gene expression analysis showed that the genes responsible for sugar metabolism were repressed as the cells entered nonculturability. The genes responsible for cell division were repressed, while autolysis and cell wall metabolism genes were induced neither at starvation nor during nonculturability. Taken together, these observations verify that carbohydrate-starved lactococci attain a nonculturable state wherein sugar metabolism, cell division, and autolysis are repressed, allowing the cells to maintain transcription, metabolic activity, and energy production during a state that produces new metabolites not associated with logarithmic growth.
Figures
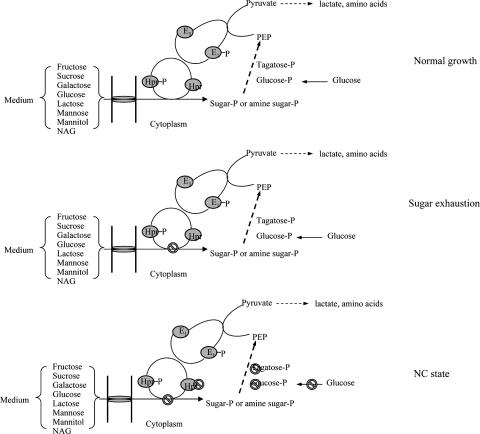
 indicates gene repression. NAG, N-acetylglucosamine.
Similar articles
-
Identification of the leucine-to-2-methylbutyric acid catabolic pathway of Lactococcus lactis.Appl Environ Microbiol. 2006 Jun;72(6):4264-73. doi: 10.1128/AEM.00448-06. Appl Environ Microbiol. 2006. PMID: 16751541 Free PMC article.
-
Influence of carbohydrate starvation and arginine on culturability and amino acid utilization of lactococcus lactis subsp. lactis.Appl Environ Microbiol. 1999 Feb;65(2):665-73. doi: 10.1128/AEM.65.2.665-673.1999. Appl Environ Microbiol. 1999. PMID: 9925598 Free PMC article.
-
Genome-wide transcriptional responses to carbon starvation in nongrowing Lactococcus lactis.Appl Environ Microbiol. 2015 Apr;81(7):2554-61. doi: 10.1128/AEM.03748-14. Epub 2015 Jan 30. Appl Environ Microbiol. 2015. PMID: 25636846 Free PMC article.
-
Bioenergetics and solute transport in lactococci.Crit Rev Microbiol. 1989;16(6):419-76. doi: 10.3109/10408418909104474. Crit Rev Microbiol. 1989. PMID: 2500949 Review.
-
Physiology of pyruvate metabolism in Lactococcus lactis.Antonie Van Leeuwenhoek. 1996 Oct;70(2-4):253-67. doi: 10.1007/BF00395936. Antonie Van Leeuwenhoek. 1996. PMID: 8879410 Review.
Cited by
-
Molecular and metabolic adaptations of Lactococcus lactis at near-zero growth rates.Appl Environ Microbiol. 2015 Jan;81(1):320-31. doi: 10.1128/AEM.02484-14. Epub 2014 Oct 24. Appl Environ Microbiol. 2015. PMID: 25344239 Free PMC article.
-
Stress response of Salmonella Newport with various sequence types toward plasma-activated water: Viable but nonculturable state formation and outer membrane vesicle production.Curr Res Food Sci. 2024 May 9;8:100764. doi: 10.1016/j.crfs.2024.100764. eCollection 2024. Curr Res Food Sci. 2024. PMID: 38779345 Free PMC article.
-
Adaptive Laboratory Evolution as a Means To Generate Lactococcus lactis Strains with Improved Thermotolerance and Ability To Autolyze.Appl Environ Microbiol. 2021 Oct 14;87(21):e0103521. doi: 10.1128/AEM.01035-21. Epub 2021 Aug 18. Appl Environ Microbiol. 2021. PMID: 34406823 Free PMC article.
-
Identifying Chemical Differences in Cheddar Cheese Based on Maturity Level and Manufacturer Using Vibrational Spectroscopy and Chemometrics.Molecules. 2023 Dec 12;28(24):8051. doi: 10.3390/molecules28248051. Molecules. 2023. PMID: 38138541 Free PMC article.
-
Stress Physiology of Lactic Acid Bacteria.Microbiol Mol Biol Rev. 2016 Jul 27;80(3):837-90. doi: 10.1128/MMBR.00076-15. Print 2016 Sep. Microbiol Mol Biol Rev. 2016. PMID: 27466284 Free PMC article. Review.
References
-
- Blake, M. R., R. Koka, and B. C. Weimer. 1996. A semiautomated reflectance colorimetric method for the determination of lipase activity in milk. J. Dairy Sci. 79:1164-1171.
-
- Boyaval, P., E. Boyaval, and M. J. Desmazeud. 1985. Survival of Brevibacterium linens during nutrient starvation and intracellular changes. Arch. Microbiol. 141:128-132. - PubMed
-
- Broadbent, J. R., M. Strickland, B. C. Weimer, M. E. Johnson, and J. L. Steele. 1998. Peptide accumulation and bitterness in cheddar cheese made using single-strain Lactococcus lactis starters with distinct proteinase specificities. J. Dairy Sci. 81:327-337.
MeSH terms
Substances
LinkOut - more resources
Full Text Sources
