. 2007 Feb;19(2):625-39.
doi: 10.1105/tpc.106.043125. Epub 2007 Feb 9.

Dominant-negative modification reveals the regulatory function of the multimeric cysteine synthase protein complex in transgenic tobacco

Affiliations

Dominant-negative modification reveals the regulatory function of the multimeric cysteine synthase protein complex in transgenic tobacco

Markus Wirtz et al. Plant Cell. 2007 Feb.

Abstract

Cys synthesis in plants constitutes the entry of reduced sulfur from assimilatory sulfate reduction into metabolism. The catalyzing enzymes serine acetyltransferase (SAT) and O-acetylserine (OAS) thiol lyase (OAS-TL) reversibly form the heterooligomeric Cys synthase complex (CSC). Dominant-negative mutation of the CSC showed the crucial function for the regulation of Cys biosynthesis in vivo. An Arabidopsis thaliana SAT was overexpressed in the cytosol of transgenic tobacco (Nicotiana tabacum) plants in either enzymatically active or inactive forms that were both shown to interact efficiently with endogenous tobacco OAS-TL proteins. Active SAT expression resulted in a 40-fold increase in SAT activity and strong increases in the reaction intermediate OAS as well as Cys, glutathione, Met, and total sulfur contents. However, inactive SAT expression produced much greater enhancing effects, including 30-fold increased Cys levels, attributable, apparently, to the competition of inactive transgenic SAT with endogenous tobacco SAT for binding to OAS-TL. Expression levels of tobacco SAT and OAS-TL remained unaffected. Flux control coefficients suggested that the accumulation of OAS and Cys in both types of transgenic plants was accomplished by different mechanisms. These data provide evidence that the CSC and its subcellular compartmentation play a crucial role in the control of Cys biosynthesis, a unique function for a plant metabolic protein complex.


Figures
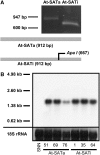
Figure 1.
Figure 1.
Molecular Characterization of Tobacco Lines Transformed with Constructs Harboring Active (At-SATa) and Inactive (At-SATi) At-SAT3 from Arabidopsis. (A) PCR with At-SAT3–specific primers and genomic DNA from tobacco as template allowed the identification of transgenic lines. Products encoding active At-SATa and inactive At-SATi were distinguished by restriction of PCR products at the ApaI site that had been introduced together with active site mutagenesis. (B) RNA gel blot hybridization of RNA from tobacco leaf with an At-SATa probe. Ethidium bromide–stained 18S rRNA served as a loading control. SNN, wild-type tobacco.
Figure 2.
Figure 2.
SAT Activity and Abundance of At-SATa and At-SATi Protein in Transgenic Tobacco. (A) Immunoblot of 7.5 μg of total leaf protein of each transgenic line decorated with polyclonal serum against Arabidopsis SAT3 protein. The Coomassie blue–stained band of Rubisco protein run in a parallel SDS-PAGE loaded with the same extracts served as a loading control. (B) Total SAT activity was determined from protein extracts of leaves of wild-type tobacco (SNN; white bars) and three independent transgenic lines expressing At-SATa (gray bars) or At-SATi (black bars). For each transformed line, mean values and sd of enzyme assays from three individual plants with three measurements each are shown (n = 9). Error bars indicate sd, and asterisks mark significant differences determined using the unpaired t test.
Figure 3.
Figure 3.
Ser and OAS Contents in Leaves of Transgenic Tobacco Plants. Three plants of wild-type tobacco (SNN; white bars) and three plants of each independent transgenic line expressing either At-SATa (gray bars) or At-SATi (black bars) were analyzed after metabolite extraction from two samples of each plant (n = 6) for Ser (A) and OAS (B). Error bars indicate sd, and asterisks mark significant differences determined using the unpaired t test.
Figure 4.
Figure 4.
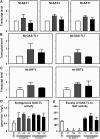
Cys, GSH, and Met Contents in Leaves of Transgenic Tobacco Plants. (A) to (C) Three plants of wild-type tobacco (SNN; white bars) and three plants of each independent transgenic line expressing either At-SATa (gray bars) or At-SATi (black bars) were analyzed using two samples per plant (n = 6) for Cys (A), GSH (B), and Met (C). (D) Total of free amino acids (aa) and sulfur-containing amino acids and the derived molar ratio of nitrogen to sulfur bound in the free amino acid fraction of wild-type (three plants) and At-SATa– or At-SATi–expressing plants (means ± sd from three plants of three transgenic lines for each construct; n = 9). Error bars indicate sd, and asterisks mark significant differences determined using the unpaired t test.
Figure 5.
Figure 5.
Total Nitrogen, Carbon and Sulfur Contents, and Anion Concentrations in Leaves of Transgenic Tobacco Plants. (A) Nitrogen, carbon, and sulfur contents. (B) Anion concentrations. Three plants of wild-type tobacco (SNN; white bars) and three plants of three independent transgenic lines expressing either At-SATa (gray bars) or At-SATi (black bars) were analyzed (n = 9). Error bars indicate sd, and asterisks mark significant differences determined using the unpaired t test.
Figure 6.
Figure 6.
Interaction of Transgenic At-SAT with Endogenous OAS-TL. Whole leaf extracts from wild-type tobacco (SNN) and transgenic lines At-SATa-69 and At-SATi-1 were applied to a Superdex 200 HiLoad column (GE Healthcare). (A) OAS-TL activity in eluted fractions was determined after a 10-min preincubation with 10 mM OAS to dissociate the CSC complex and determine all present OAS-TL activity. (B) An enlarged portion of (A). (C) The top three panels show immunoblots of SDS-PAGE gels of column fractions 1 to 30 using serum against Arabidopsis SAT3 protein. The bottom two panels show Coomassie blue stains of Rubisco large and small subunits (LSU and SSU) from the same gels as separation controls. (D) Ratio of CSC-associated OAS-TL activity in transgenic and wild-type tobacco (calculated from [B]). Error bars represent sd, and data are based on three measurements of OAS-TL activity.
Figure 7.
Figure 7.
Heterologous At-SAT and Nt-OAS-TL Interaction Maintains Features of Functional CSC. (A) Transgenic At-SAT was pulled down from protein extracts of wild-type tobacco (SNN) and transgenic lines expressing either At-SATa or At-SATi using a polyclonal serum against Arabidopsis SAT3 protein (+). As a negative control, SAT3 antiserum was omitted (−). Endogenous OAS-TL bound to At-SAT was eluted by specific dissociation of CSC with 10 mM OAS for 5 min. The identity of copurified OAS-TL was verified by its activity. (B) Endogenous Nt-OAS-TL from wild-type tobacco was inactivated by titration with At-SATi protein as a result of CSC formation. Error bars represent sd and are based on three measurements of OAS-TL activity.
Figure 8.
Figure 8.
Expression of Sulfur Metabolism–Related Genes in Leaves of Transgenic Tobacco Plants. Transcript levels of endogenous SAT (A), OAS-TL (B), and glutathione reductase (GRT) (C) were analyzed by RNA gel blot hybridization of total mRNA from leaves of wild-type tobacco (SNN; white bars) and three independent transgenic lines expressing either At-SATa (gray bars) or At-SATi (black bars). In addition, total OAS-TL activity (D) was determined from protein extracts of leaves. Mean values and sd of enzyme assays from three individual plants with three measurements each are shown (n = 9). The excess of OAS-TL to SAT activity (E) was calculated using the SAT activity shown in Figure 4. Asterisks mark significant differences determined using the unpaired t test. Error bars represent sd.
Figure 9.
Figure 9.
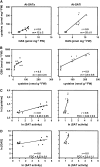
Flux Control Coefficients of SAT and Correlations of Metabolites Inside the Sulfur Network of Transgenic Tobacco Plants. Steady state levels of OAS and Cys (A) as well as Cys and GSH (B) in leaves of wild-type tobacco (triangles) and three independent transgenic lines for At-SATa (closed circles) or At-SATi (open circles) were plotted (n = 12) and fitted by linear regression (y = m × x + b). The correlation coefficient (r) and the slope (m) for each fit are shown inside the panel. The flux control coefficient (FCC) of SAT for Cys (C) and OAS (D) was determined as described by Wu et al. (2004).
Figure 10.
Figure 10.
Organization of Cys Biosynthesis Pathways in Plant Cells and Transgenic Tobacco Expressing At-SATa or At-SATi in the Cytosol. (A) Schematic overview of enzymatic activities and metabolites involved in the synthesis of Cys in the cytosol (white panel), the mitochondrion (light gray panel), and the chloroplast (dark gray panel). Enzymes are indicated in boldface letters. Black fields of the pie charts show the ratio of enzymatic activities present inside the respective compartment as a percentage of total extractable activity calculated from subcellular fractionation experiments with pea and spinach leaves (Droux, 2004). Solid arrows represent enzymatic reactions, and broken arrows indicate transport of metabolites across membranes. (B) Relative fluxes of OAS and Cys (indicated by the size of the solid arrows) in different subcellular compartments as deduced from the enzymatic activities of SAT and OAS-TL. Endogenous tobacco SAT (triangles) is associated with OAS-TL (squares) to form the CSC. Black triangles and squares indicate the active forms of enzymes, and white triangles indicate inactivated or less active enzymes. The solid double-headed arrow through the broken circle indicates that the nucleus as a control center of sulfur-related gene expression is in equilibrium with concentrations of thiols (sulfide, Cys, and GSH) and OAS in the cytosol. These effector concentrations and the degree of CSC association are believed to keep a certain balance to achieve coordinated transcriptional control of the genes of sulfur uptake and assimilation. (C) and (D) Overexpression of At-SATa (black circles) (C) and At-SATi (white circles) (D) in the cytosol. The impact on subcellular fluxes and the transport of metabolites across membranes as a consequence of disturbed CSC formation in the cytosol and metabolite signaling in the nucleus are indicated by the size of the arrows.

Similar articles

Cited by

References

    1. Berkowitz, O., Wirtz, M., Wolf, A., Kuhlmann, J., and Hell, R. (2002). Use of biomolecular interaction analysis to elucidate the regulatory mechanism of the cysteine synthase complex from Arabidopsis thaliana. J. Biol. Chem. 277 30629–30634. - PubMed
    1. Blaszczyk, A., Brodzik, R., and Sirko, A. (1999). Increased resistance to oxidative stress in transgenic tobacco plants overexpressing bacterial serine acetyltransferase. Plant J. 20 237–243. - PubMed
    1. Bogdanova, N., Bork, C., and Hell, R. (1995). Cysteine biosynthesis in plants: Isolation and functional identification of a cDNA encoding a serine acetyltransferase from Arabidopsis thaliana. FEBS Lett. 358 43–47. - PubMed
    1. Bogdanova, N., and Hell, R. (1997). Cysteine synthesis in plants: Protein-protein interactions of serine acetyltransferase from Arabidopsis thaliana. Plant J. 11 251–262. - PubMed
    1. Boorer, K.J., Frommer, W.B., Bush, D.R., Kreman, M., Loo, D.D., and Wright, E.M. (1996). Kinetics and specificity of a H+/amino acid transporter from Arabidopsis thaliana. J. Biol. Chem. 271 2213–2220. - PubMed

Publication types

MeSH terms