Comparative Study
. 2007 Mar;10(3):321-30.
doi: 10.1038/nn1854. Epub 2007 Feb 11.

Vesicular release of glutamate from unmyelinated axons in white matter

Affiliations
Comparative Study

Vesicular release of glutamate from unmyelinated axons in white matter

Jennifer L Ziskin et al. Nat Neurosci. 2007 Mar.

Abstract

Directed fusion of transmitter-laden vesicles enables rapid intercellular signaling in the central nervous system and occurs at synapses within gray matter. Here we show that action potentials also induce the release of glutamate from axons in the corpus callosum, a white matter region responsible for interhemispheric communication. Callosal axons release glutamate by vesicular fusion, which induces quantal AMPA receptor-mediated currents in NG2(+) glial progenitors at anatomically distinct axo-glial synaptic junctions. Glutamate release from axons was facilitated by repetitive stimulation and could be inhibited through activation of metabotropic autoreceptors. Although NG2(+) cells form associations with nodes of Ranvier in white matter, measurements of conduction velocity indicated that unmyelinated fibers are responsible for glutamatergic signaling with NG2(+) glia. This activity-dependent secretion of glutamate was prevalent in the developing and mature mouse corpus callosum, indicating that axons within white matter both conduct action potentials and engage in rapid neuron-glia communication.


Conflict of interest statement

COMPETING INTERESTS STATEMENT

The authors declare that they have no competing financial interests.

Figures
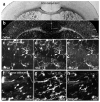
Figure 1
Figure 1
NG2+ cells express DsRed in NG2-DsRed BAC mice. (a) Coronal brain section from a P24 NG2-DsRed BAC transgenic mouse. (b) DsRed fluorescence image from the same section as in a. (ce) CA1 region of the hippocampus from a P30 NG2-DsRed BAC transgenic mouse showing DsRed fluorescence (c), NG2 immunoreactivity (d) and PDGFαR immunoreactivity (e). (fh) Section of corpus callosum from the same P30 mouse showing DsRed fluorescence (f), NG2 immunoreactivity (g) and PDGFαR immunoreactivity (h). Arrows in each panel highlight one NG2+ glial cell.
Figure 2
Figure 2
Spontaneous release of glutamate within the corpus callosum activates AMPA receptors in NG2+ glial cells. (a) Whole-cell current-clamp recording from a DsRed+ cell in the corpus callosum showing responses to current injection. VM = −97 mV. Current steps: −90, −30, 30, 90, 150, 210, 270 and 330 pA. (b) Activation of NMDA receptors (upper traces) and AMPA receptors (lower traces) in DsRed+ cells by focal application of NMDA (100 μM) and kainate (200 μM), respectively. NMDAR responses were blocked by d,l-CPP (upper red trace) (10 μM) and AMPAR responses were blocked by GYKI 53655 (100 μM) (lower red trace). (c) Spontaneous EPSCs recorded from a corpus callosum NG2+ cell. Inward currents highlighted by an asterisk are shown at an expanded time scale (inset). (d) Individual spontaneous EPSPs recorded from an NG2+ cell in current clamp (upper traces) and the average EPSP waveform calculated from 24 events (lower trace). VM = −104 mV.
Figure 3
Figure 3
Stimulation of axons within the corpus callosum evokes the release of glutamate. (a) Response of an NG2+ cell to paired stimulation of corpus callosum axons (50 ms ISI), recorded at room temperature (22–24 °C) and near physiological temperature (36 °C). Evoked responses were blocked by GYKI 53655 (100 μM). (b) Series of responses evoked with stimuli of different intensities (left, traces) and plot of the peak amplitude of the responses versus stimulus intensity (right, graph). Stimulation intensities: 5, 10, 12.5, 15, 20, 30, 50 and 70 μA. (c) Averaged responses and plot of peak amplitudes of evoked AMPAR currents recorded from an NG2+ cell in response to paired stimulation. Responses were blocked by cadmium (Cd, 30 μM, blue trace) and NBQX (10 μM, red trace). Open circles, first response amplitude; closed circles, second response amplitude. (d) Bursts of EPSCs recorded from a callosal NG2+ cell in the presence of gabazine (5 μM).
Figure 4
Figure 4
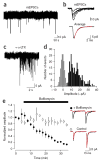
AMPAR currents in callosal NG2+ cells arise from vesicular release of glutamate. (a) Spontaneous mEPSCs recorded from an NG2+ cell in the presence of TTX (1 μM). (b) Five individual mEPSCs and the average mEPSC are shown from the recording in (a). The red line is a single exponential fit to the decay (tau decay = 1.6 ms). (c) A burst of mEPSCs recorded in an NG2+ cell after exposure to α-latrotoxin (5 nM). (d) Graph of the amplitude distribution of α-latrotoxin induced mEPSCs (black bars) and baseline noise (gray bars, scaled to peak of mEPSC distribution). (e) Inhibition of glutamate loading into vesicles with the proton pump inhibitor bafilomycin A1 (Baf, 2 μM) caused a progressive decrease in evoked AMPA currents in NG2+ cells. Traces at right show the average response before application of Baf (black traces) and after 30 min in the presence (red, top trace) or absence (red, bottom trace) of Baf.
Figure 5
Figure 5
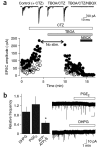
AMPAR currents in NG2+ cells are not produced by reversed cycling of glutamate transporters or by vesicular release from astrocytes. (a) Evoked AMPA receptor responses persist in the presence of the glutamate transporter inhibitor TBOA (100 μM). Cyclothiazide (CTZ, 100 μM) was applied to prevent desensitization of AMPAR during uptake blockade. The stimulation was stopped during the initial application of TBOA to prevent glutamate accumulation. Traces above show ten superimposed responses to paired stimulation in the different pharmacological conditions. Open circles are the responses to the first stimulus; closed circles are the responses to the second stimulus. (b) Stimulation of astrocytes does not increase the frequency of mEPSCs in callosal NG2+ cells. Graph shows the relative frequency (drug/control) of mEPSCs recorded after 5 min in DHPG (15 μM, n = 11), PGE2 (10 μM, n = 11) and ATP/ATPγS (100 μM, n = 17). Traces at the right are continuous recordings of mEPSCs showing the response of cells to PGE2 (upper trace) and DHPG (lower trace).
Figure 6
Figure 6
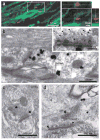
Axons form defined synaptic junctions with NG2+ cells within the corpus callosum. (a) Triple-immunofluorescence of NG2 (green), VGLUT1 (red) and Map2 (blue) immunoreactivity in a projection image showing close association between VGLUT1+ puncta and NG2+ processes; these VGLUT1+ puncta were not in close proximity to neuronal dendrites (blue process, left image). The area circumscribed by the white box is shown in an orthogonal reconstruction with x-z and y-z planes extracted at the levels indicated by the white lines (right). (b) Thin-section electron micrograph from the corpus callosum. Silver-enhanced pre-embedding immunogold for DsRed shows an NG2+ cell process (DsRed) opposed to a nerve terminal (NT) containing small clear vesicles. The inset shows the active zone region at higher magnification, illustrating the region of close apposition between axon and NG2+ cell membranes, the accumulation of electron-dense material, and the presence of small (∼35-nm-diameter) vesicles in the axon. (c) Thin-section electron micrograph from the cortex showing VGLUT1 immunoreactivity (silver-enhanced immunogold, VGLUT1) in a terminal bouton that forms two synapses with dendritic spines (S). (d) Thin-section electron micrograph from the corpus callosum showing VGLUT1 immunoreactivity (silver-enhanced immunogold, VGLUT1) in an axon that forms a synaptic junction (highlighted by arrowheads) with a lightly labeled NG2+ cell process (DsRed immunoreactivity, horseradish peroxidase product).
Figure 7
Figure 7
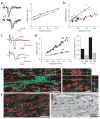
Glutamate is released from unmyelinated axons in the corpus callosum. (a) Left, example traces recorded from an NG2+ cell after callosal axon stimulation at distances of 70 μm (upper traces, open red circle) and 640 μm (lower traces, filled red circle). Inverted arrowhead denotes time of stimulation. Right, plot of change in delay between stimulation and onset of EPSC recorded with increasing separation of stimulation electrode and NG2+ cell. Each color corresponds to responses of one cell; red circles correspond to the traces shown at left. (b) Plot of delay time versus distance for synaptic responses recorded from 7 callosal NG2+ cells (filled circles, red line) and 13 hippocampal CA1 pyramidal neurons (open circles, black line). Lines represent regression fits to the points (P33–P51 NG2+ cells; P20–P33 pyramidal neurons). (c) Extracellular recordings of compound action potentials (CAPs) generated by myelinated (M) and unmyelinated (UM) fibers in the corpus callosum, showing the sensitivity to TTX (1 μM) and 4-aminopyridine (4-AP, 10 μM) (lower red trace). (d) Left, plot of delay time versus distance for myelinated (M, open squares) and unmyelinated (UM, filled squares) fibers at 37 °C. Right, conduction velocities of myelinated and unmyelinated fibers calculated from extracellular CAPs. Ages for c and d were P32–P37. (e) Double-immunofluorescence for NG2 (green) and Caspr (red) shown in a projection image with isosurface rendering of the NG2+ cell (left). The area circumscribed by the white box is shown in an orthogonal reconstruction with x-z and y-z planes extracted at levels indicated by the white lines (right). Age, P30. (f) Double-immunofluorescence for Caspr (red) and VGLUT1 (green) shown in a projection image. (g) Silver-enhanced pre-embedding immunogold for DsRed showing extensive contact between an unmyelinated axon (UA) and DsRed+ processes in the corpus callosum. Age, P35.
Figure 8
Figure 8
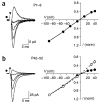
NG2+ cells in the adult corpus callosum express Ca2+-permeable AMPARs. (a) Evoked EPSCs recorded from an NG2+ cell in the developing corpus callosum (P8) with an internal solution containing spermine (left traces) at holding potentials of −90, −50, −10 and 30 mV. At right is the current-voltage (I-V) relationship of AMPAR currents elicited in NG2+ cells in young animals (P7–P8) (n = 4). These responses showed little rectification, indicating that few Ca2+-permeable AMPARs were activated. (b) Evoked EPSCs recorded from an NG2+ cell in the mature corpus callosum (P52) with an internal solution containing spermine (left traces) at holding potentials of −90, −50, −10 and 30 mV. At right is the I-V relationship of AMPAR currents elicited in NG2+ cells in mature animals (P42–P52), when spermine was present (filled circles, n = 8)) or absent (open circles, n = 3) from the internal solution. Responses at this age showed prominent inward rectification, indicating that Ca2+-permeable AMPARs contributed to the EPSCs.

Comment in

Similar articles

Cited by

References

    1. Barbour B. An evaluation of synapse independence. J Neurosci. 2001;21:7969–7984. - PMC - PubMed
    1. Clancy B, Silva-Filho M, Friedlander MJ. Structure and projections of white matter neurons in the postnatal rat visual cortex. J Comp Neurol. 2001;434:233–252. - PubMed
    1. Kriegler S, Chiu SY. Calcium signaling of glial cells along mammalian axons. J Neurosci. 1993;13:4229–4245. - PMC - PubMed
    1. Fulton BP, Burne JF, Raff MC. Visualization of O-2A progenitor cells in developing and adult rat optic nerve by quisqualate-stimulated cobalt uptake. J Neurosci. 1992;12:4816–4833. - PMC - PubMed
    1. Karadottir R, Cavelier P, Bergersen LH, Attwell D. NMDA receptors are expressed in oligodendrocytes and activated in ischaemia. Nature. 2005;438:1162–1166. - PMC - PubMed

Publication types

MeSH terms