. 2007 Mar;10(3):285-92.
doi: 10.1038/nn1848. Epub 2007 Feb 11.

Alternative splicing controls G protein-dependent inhibition of N-type calcium channels in nociceptors

Affiliations

Alternative splicing controls G protein-dependent inhibition of N-type calcium channels in nociceptors

Jesica Raingo et al. Nat Neurosci. 2007 Mar.

Abstract

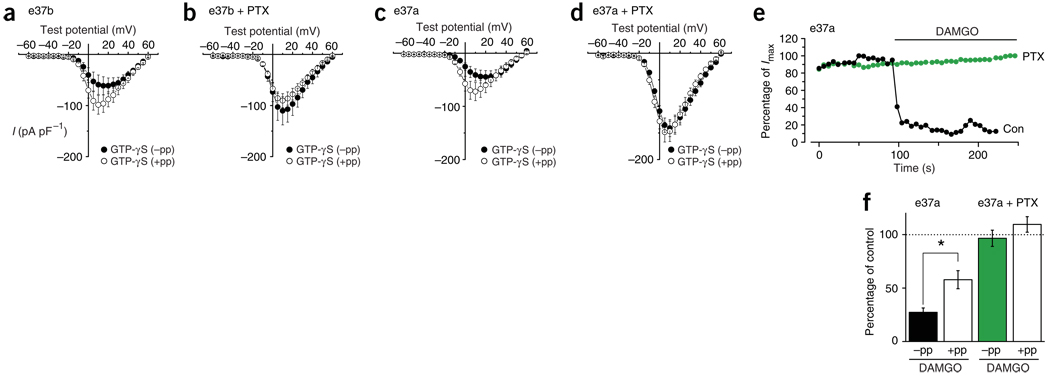
Neurotransmitter release from mammalian sensory neurons is controlled by Ca(V)2.2 N-type calcium channels. N-type channels are a major target of neurotransmitters and drugs that inhibit calcium entry, transmitter release and nociception through their specific G protein-coupled receptors. G protein-coupled receptor inhibition of these channels is typically voltage-dependent and mediated by Gbetagamma, whereas N-type channels in sensory neurons are sensitive to a second G protein-coupled receptor pathway that inhibits the channel independent of voltage. Here we show that preferential inclusion in nociceptors of exon 37a in rat Cacna1b (encoding Ca(V)2.2) creates, de novo, a C-terminal module that mediates voltage-independent inhibition. This inhibitory pathway requires tyrosine kinase activation but not Gbetagamma. A tyrosine encoded within exon 37a constitutes a critical part of a molecular switch controlling N-type current density and G protein-mediated voltage-independent inhibition. Our data define the molecular origins of voltage-independent inhibition of N-type channels in the pain pathway.


Figures

Figure 1
Figure 1
G protein activation differentially inhibits CaV2.2e[37b] and CaV2.2e[37a] channels. Calcium currents from cells expressing (a) CaV2.2e[37b] (e37b) and (b) CaV2.2e[37a] (e37a) channels recorded with control (con) internal solution and with 0.4 mM internal GTP-γS. Currents were evoked by test pulses alone (−pp) and preceded by a prepulse to +80 mV (+pp). In the presence of GTP-γS, prepulses to +80 mV recovered CaV2.2e[37b] currents fully (a; current densities not significantly different from control; P > 0.5). Prepulses only partially recovered inhibited CaV2.2e[37a] currents (b; current densities significantly different from control at test voltages between −5 mV and +55 mV, P < 0.05). Prepulses did not induce facilitation in the absence of internal GTP-γS. Values of n for panel a are 20 (con), 16 (−pp) and 16 (+pp). Values of n for panel b are 21 (con), 21 (−pp) and 21 (+pp). (c) Currents evoked by test pulses to +80 mV in control and in the presence of 0.4 mM internal GTP-γS. Exemplar currents are shown above average (mean ± s.e.m. throughout) current densities for each isoform. Number of cells in each dataset is indicated. CaV2.2e[37a] current densities in the presence of GTP-γS are significantly different from control (*P = 0.0024).
Figure 2
Figure 2
Prepulse relieves voltage-dependent inhibition fully. Averaged, normalized activation curves generated from tail currents recorded at −60 mV in cells expressing (a) CaV2.2e[37b] and (b) CaV2.2e[37a] channels in the absence (con; n = 4 and 6) and presence of GTP-γS without (−pp; n = 5 and 3) and with (+pp; n = 5 and 3) prepulse. Recording conditions are the same as in Figure 1. Activation curves only reflect data from recordings with rapid settling times that permit accurate resolution of calcium channel tail currents. The sum of two Boltzmann functions fit individual datasets. Insets in a show examples of tail currents evoked by a hyperpolarizing step to −60 mV from a test depolarization to +10 mV. Amplitudes are normalized to peak current.
Figure 3
Figure 3
Differential inhibition of CaV2.2e[37b] and CaV2.2e[37a] channels by GABAB receptor activation. (af) Calcium currents recorded using the perforated-patch technique from cells expressing CaV2.2e[37b] channels (a,c,d; n = 11) and CaV2.2e[37a] channels (b,e,f; n = 10) together with GABABR1a and GABABR2 subunits. Peak currents evoked by test pulses to 0 mV recorded from representative cells expressing CaV2.2e[37b] (a) and CaV2.2e[37a] (b) illustrate the time course of inhibition mediated by 50 µM baclofen. Exemplar CaV2.2e[37b] (c) and CaV2.2e[37a] (e) currents together with average, peak current densities as a percentage of control (d,f) recorded in the absence (con) and presence of baclofen without (−pp) and with (+pp) a prepulse to +80 mV. In f, the prepulse is only partially effective at recovering CaV2.2e[37a] current inhibited by baclofen (*significantly different from 100%; P < 0.0001).
Figure 4
Figure 4
Differential inhibition of CaV2.2e[37b] and CaV2.2e[37a] channels by μ-opioid receptor activation. (af) Calcium currents recorded using the perforated-patch technique from cells expressing CaV2.2e[37b] channels (a,c,d; n = 10) and CaV2.2e[37a] channels (b,e,f; n = 6) together with μ-opioid receptor. Peak currents evoked by test pulses to 0 mV recorded from representative cells expressing CaV2.2e[37b] (a) and CaV2.2e[37a] (b) illustrate the time course of inhibition mediated by 10 µM DAMGO. Exemplar CaV2.2e[37b] (c) and CaV2.2e[37a] (e) currents together with average, peak currents as a percentage of control (d,f) recorded in the absence (con) and presence of DAMGO without (−pp) and with (+pp) a prepulse to +80 mV. Significant CaV2.2e[37a] current remains inhibited by DAMGO when evoked by test potentials preceded with a step to +80 mV (f) (*significantly different from 100%; P < 0.0001).
Figure 5
Figure 5
PTX-sensitive G proteins mediate inhibition of CaV2.2 isoforms. (a,b) CaV2.2 e[37b]) and (c,d) CaV2.2e[37a] currents recorded with internal GTP-γS from untreated cells (a,c) and cells pretreated with PTX (500 ng ml−1 for 16 h) (b,d) without (−pp) and with (+pp) a prepulse to +80 mV. a, n = 7; b, n = 6; c, n = 7; d, n = 7. CaV2.2e[37a] current densities were significantly greater after PTX pretreatment than those in untreated cells (P = 0.0154, +10 mV, +pp). (e,f) CaV2.2e[37a] currents in cells coexpressing the μ-opioid receptor. Recordings without and with prepulse to +80 mV are compared in untreated (n = 7) and PTX-treated (n = 7) cells. (e) Representative time course of current amplitude as a percentage of current before exposure to 10 µM DAMGO of CaV2.2e[37a] currents from an untreated cell (con) and one preincubated with PTX. DAMGO inhibited currents in untreated cells, and currents were significantly greater after prepulse (*P = 0.007). (f) Average CaV2.2e[37a] currents in the presence of 10 µM DAMGO expressed as a percentage of control currents. DAMGO had no effect on currents in cells pretreated with PTX (not significantly different from 100%; P = 0.66 without prepulse and P = 0.23 with prepulse).
Figure 6
Figure 6
Voltage-dependent but not voltage-independent inhibition requires Gβγ. Average current-voltage relationships for currents recorded in cells expressing MAS-GRK2-ct (ref. 28) together with (a,b,c) CaV2.2e[37b] and (d,e,f) CaV2.2e[37a] in the absence (a,d) and presence (b,e) of GTP-γS (0.4 mM). Average (c) CaV2.2e[37b] and (f) CaV2.2e[37a] current densities recorded at 0 mV. CaV2.2e[37b] currents recorded with internal GTP-γS were not significantly different (NS) from control currents at all potentials with (+pp) or without (−pp) prepulse. CaV2.2e[37a] currents recorded in cells expressing MAS-GRK2-ct were inhibited by internal GTP-γS (f; *P = 0.00678), but inhibition was unaffected by a prepulse. For a, n = 10; b, n = 10; c, n = 11 and n = 10 (GTP-γS); d, n = 10; e, n = 10; f, n = 11 and n = 12 (GTP-γS).
Figure 7
Figure 7
pp60c-src tyrosine kinase peptide inhibitor prevents voltage-independent inhibition. (ad) Averaged, peak current voltage-relationships from cells expressing CaV2.2e[37b] (a, n = 7; b, n = 8) and CaV2.2e[37a] (c, n = 9; d, n = 10) in the presence of 0.4 mM internal GTP-γS with (+pp) and without (−pp) prepulses to +80 mV. Currents recorded from cells without (a,c) and with (b,d) 70 µM pp60c-src peptide inhibitor (pp60c-src) in the pipette. CaV2.2e[37b] currents with and without pp60c-src peptide are not significantly different at any test potential (P > 0.05). Control CaV2.2e[37a] currents (c) compared with recordings with 70 µM pp60c-src peptide (d) are significantly different at test potentials between −20 mV and +55 mV in presence or absence of the prepulse (P < 0.05). (eh) Average peak current density values at 0 mV from cells expressing μ-opioid receptor together with CaV2.2e[37b] (e,f) and CaV2.2e[37a] (g,h). Currents recorded using standard whole-cell method without (−pp) and with (+pp) prepulses to +80 mV in the absence (con) and presence of DAMGO with and without pp60c-src tyrosine kinase peptide inhibitor. CaV2.2e[37a] currents recorded in the presence of DAMGO remained significantly inhibited after a prepulse compared with control (g, *P = 0.0076; voltage-independent inhibition), but the peptide inhibitor prevented this form of inhibition (h, not significant (NS)). For e, n = 7; f, n = 7; g, n = 10; h, n = 10. Exemplar current traces are shown above bar graphs.
Figure 8
Figure 8
Conservation of exon 37a and essential role of Y1747 in voltage-independent inhibition. (a) Amino acid sequence alignments for exons e37a and e37b of human, chimpanzee (chimp), macaque, dog, rat, mouse and chicken CaV2.2 genes. Arrows highlight two tyrosine kinase consensus sites at positions 1743 and 1747 in rat e37a. Bold font indicates 100% conservation across species. The sequence encoding the first amino acid of chimpanzee e37b was located close to a gap in the chimpanzee genome sequence. (b,c) Averaged peak current-voltage relationships from cells expressing CaV2.2e[37a]Y1743F mutant channels (b) and CaV2.2e[37a]Y1747F mutant channels (c) with control internal solution (con, n = 9 and n = 10) and with GTP-γS–containing internal solution without (−pp; n = 7 and n = 8) and with (+pp; n = 7 and n = 8) prepulses to +80 mV. Upper panels show exemplar currents evoked at +10 mV for each dataset. The prepulse did not fully relieve GTP-γS inhibition of CaV2.2e[37a] Y1743F current densities, which were significantly different from control at test pulses between −15 mV and +35 mV (P < 0.05). The prepulse relieved GTP-γS inhibition of CaV2.2e[37a] Y1747F completely. Control CaV2.2e[37a]Y1747F current densities were not significantly different from GTP-γS recordings with prepulses.

Comment in

References

    1. Bourinet E, Zamponi GW. Voltage gated calcium channels as targets for analgesics. Curr. Top. Med. Chem. 2005;5:539–546. - PubMed
    1. Dunlap K, Fischbach GD. Neurotransmitters decrease the calcium conductance activated by depolarization of embryonic chick sensory neurones. J. Physiol. (Lond.) 1981;317:519–535. - PMC - PubMed
    1. Holz GG, IV, Rane SG, Dunlap K. GTP-binding proteins mediate transmitter inhibition of voltage-dependent calcium channels. Nature. 1986;319:670–672. - PMC - PubMed
    1. Taddese A, Nah SY, McCleskey EW. Selective opioid inhibition of small nociceptive neurons. Science. 1995;270:1366–1369. - PubMed
    1. Polo-Parada L, Pilar G. κ- and μ-opioids reverse the somatostatin inhibition of Ca2+ currents in ciliary and dorsal root ganglion neurons. J. Neurosci. 1999;19:5213–5227. - PMC - PubMed

Publication types

MeSH terms

Associated data