. 2007 Feb 12:7:8.
doi: 10.1186/1472-6750-7-8.

Elimination of laboratory ozone leads to a dramatic improvement in the reproducibility of microarray gene expression measurements

Affiliations

Elimination of laboratory ozone leads to a dramatic improvement in the reproducibility of microarray gene expression measurements

William S Branham et al. BMC Biotechnol. .

Abstract

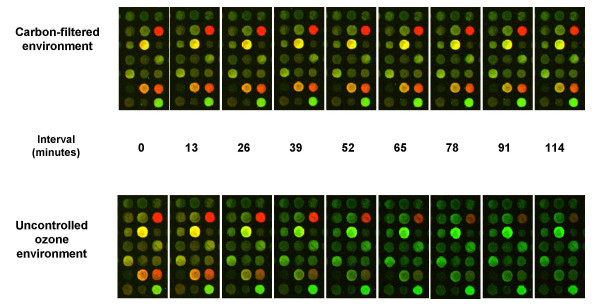
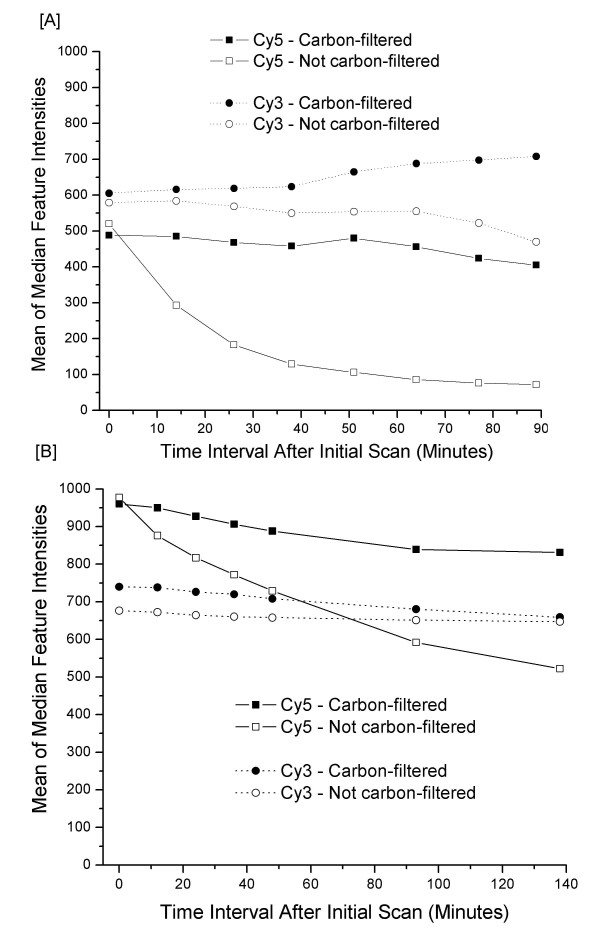
Background: Environmental ozone can rapidly degrade cyanine 5 (Cy5), a fluorescent dye commonly used in microarray gene expression studies. Cyanine 3 (Cy3) is much less affected by atmospheric ozone. Degradation of the Cy5 signal relative to the Cy3 signal in 2-color microarrays will adversely reduce the Cy5/Cy3 ratio resulting in unreliable microarray data.

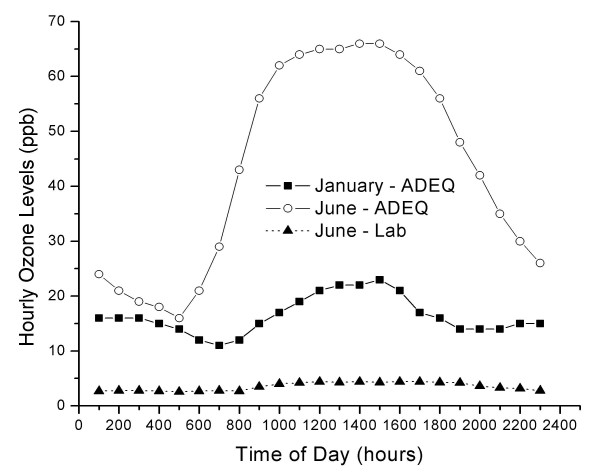
Results: Ozone in central Arkansas typically ranges between approximately 22 ppb to approximately 46 ppb and can be as high as 60-100 ppb depending upon season, meteorological conditions, and time of day. These levels of ozone are common in many areas of the country during the summer. A carbon filter was installed in the laboratory air handling system to reduce ozone levels in the microarray laboratory. In addition, the airflow was balanced to prevent non-filtered air from entering the laboratory. These modifications reduced the ozone within the microarray laboratory to approximately 2-4 ppb. Data presented here document reductions in Cy5 signal on both in-house produced microarrays and commercial microarrays as a result of exposure to unfiltered air. Comparisons of identically hybridized microarrays exposed to either carbon-filtered or unfiltered air demonstrated the protective effect of carbon-filtration on microarray data as indicated by Cy5 and Cy3 intensities. LOWESS normalization of the data was not able to completely overcome the effect of ozone-induced reduction of Cy5 signal. Experiments were also conducted to examine the effects of high humidity on microarray quality. Modest, but significant, increases in Cy5 and Cy3 signal intensities were observed after 2 or 4 hours at 98-99% humidity compared to 42% humidity.

Conclusion: Simple installation of carbon filters in the laboratory air handling system resulted in low and consistent ozone levels. This allowed the accurate determination of gene expression by microarray using Cy5 and Cy3 fluorescent dyes.


Figures

Figure 1
Figure 1
Diurnal ozone fluctuations. The means of hourly atmospheric ozone levels measured during January and June 2005 in central Arkansas by the ADEQ along with carbon-filtered laboratory air are shown. Peak ozone concentrations averaged 56–66 ppb between 0900 and 1800. Hourly ozone levels during this period commonly reached 60–90 ppb with the highest level reaching 103 ppb. By contrast, laboratory ozone levels varied between 2.6 and 4.4 ppb after installation of the carbon-filtered air supply.
Figure 2
Figure 2
Reduction of Cy5 signal for in-house fabricated microarrays kept in a none-ozone controlled environment. These figures show a region of two 20 K mouse microarrays, selected because of their wide range of both Cy5 and Cy3 signals. The microarray images were from scans made during a 114 minute experiment interval. While the microarrays maintained in the carbon-filtered laboratory environment (ozone ~2–4 ppb) remained relatively unchanged with time (top images), reduction in Cy5 in the uncontrolled ozone environment (ozone ~25 ppb) causes the microarray image to have a predominantly green cast (bottom images).
Figure 3
Figure 3
Dramatic improvement of Cy5 fluorescence stability as a result of ozone depletion. Pairs of microarrays printed in-house [A] or printed by Agilent Technologies [B] were hybridized and initially scanned immediately after washing in the carbon-filtered lab. One of each of the pairs of slides was then moved to an environment in which ozone was not removed by carbon filtration (ozone ~25 ppb for the in-house produced slide and ~10 ppb for the Agilent slide). The remaining slide remained in the ozone controlled microarray laboratory (ozone ~2–4 ppb). The slides were then alternately rescanned 6 times. The data show the rapid decline in Cy5 feature intensities as early as 13 minutes in the non-ozone controlled environment. It should be noted that the "ozone-exposed" microarray was not exposed to ozone while it was being scanned.

References

    1. Bammler T, Beyer RP, Bhattacharya S, Boorman GA, Boyles A, Bradford BU, Bumgarner RE, Bushel PR, Chaturvedi K, Choi D, et al. Standardizing global gene expression analysis between laboratories and across platforms. Nat Methods. 2005;2:351–356. doi: 10.1038/nmeth754. - DOI - PubMed
    1. Draghici S, Khatri P, Eklund AC, Szallasi Z. Reliability and reproducibility issues in DNA microarray measurements. Trends Genet. 2006;22:101–109. doi: 10.1016/j.tig.2005.12.005. - DOI - PMC - PubMed
    1. Imbeaud S, Auffray C. 'The 39 steps' in gene expression profiling: critical issues and proposed best practices for microarray experiments. Drug Discov Today. 2005;10:1175–1182. doi: 10.1016/S1359-6446(05)03565-8. - DOI - PubMed
    1. Fare TL, Coffey EM, Dai H, He YD, Kessler DA, Kilian KA, Koch JE, LeProust E, Marton MJ, Meyer MR, et al. Effects of atmospheric ozone on microarray data quality. Anal Chem. 2003;75:4672–4675. doi: 10.1021/ac034241b. - DOI - PubMed
    1. U.S. EPA http://www.epa.gov/epahome/ozone.htm

Publication types