Glycogen synthase kinase 3, circadian rhythms, and bipolar disorder: a molecular link in the therapeutic action of lithium
- PMID: 17295926
- PMCID: PMC1803776
- DOI: 10.1186/1740-3391-5-3
Glycogen synthase kinase 3, circadian rhythms, and bipolar disorder: a molecular link in the therapeutic action of lithium
Abstract
Background: Bipolar disorder (BPD) is a widespread condition characterized by recurring states of mania and depression. Lithium, a direct inhibitor of glycogen synthase kinase 3 (GSK3) activity, and a mainstay in BPD therapeutics, has been proposed to target GSK3 as a mechanism of mood stabilization. In addition to mood imbalances, patients with BPD often suffer from circadian disturbances. GSK3, an essential kinase with widespread roles in development, cell survival, and metabolism has been demonstrated to be an essential component of the Drosophila circadian clock. We sought to investigate the role of GSK3 in the mammalian clock mechanism, as a possible mediator of lithium's therapeutic effects.
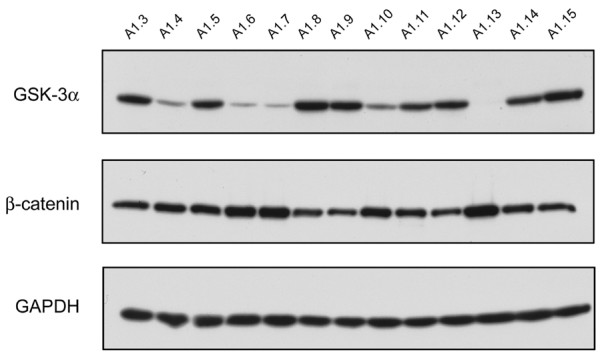
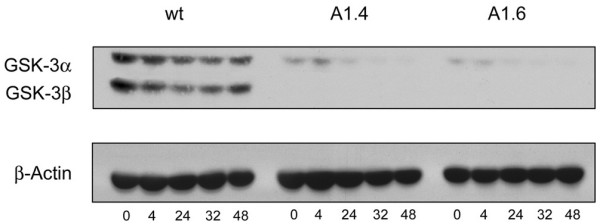
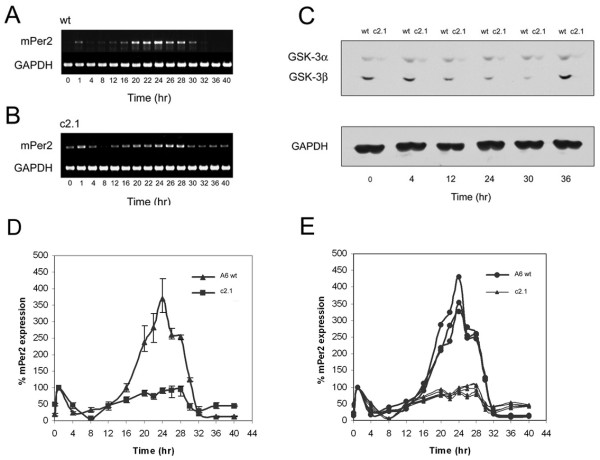
Methods: GSK3 activity was decreased in mouse embryonic fibroblasts (MEFs) genetically and pharmacologically, and changes in the cyclical expression of core clock genes--mPer2 in particular--were examined.
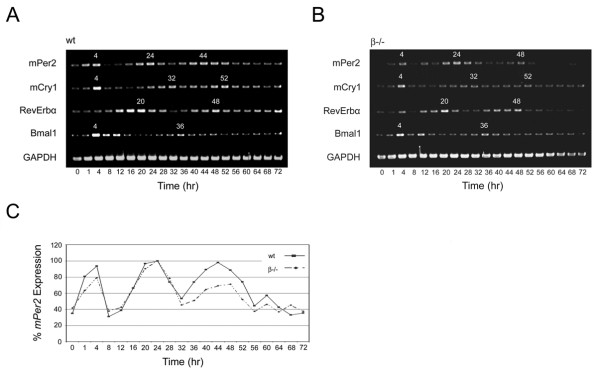
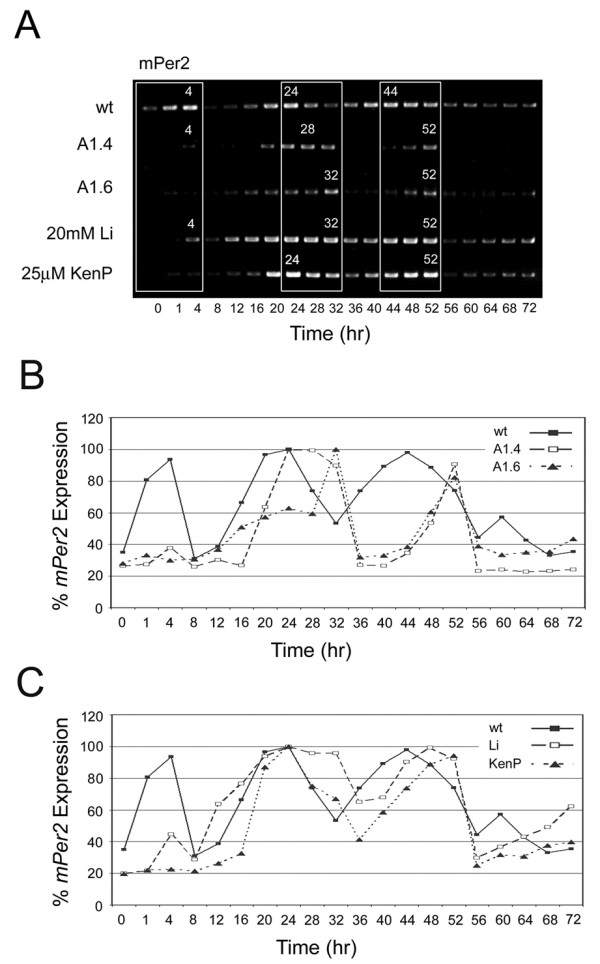
Results: We demonstrate that genetic depletion of GSK3 in synchronized oscillating MEFs results in a significant delay in the periodicity of the endogenous clock mechanism, particularly in the cycling period of mPer2. Furthermore, we demonstrate that pharmacological inhibition of GSK3 activity by kenpaullone, a known antagonist of GSK3 activity, as well as by lithium, a direct inhibitor of GSK3 and the most common treatment for BPD, induces a phase delay in mPer2 transcription that resembles the effect observed with GSK3 knockdown.
Conclusion: These results confirm GSK3 as a plausible target of lithium action in BPD therapeutics, and suggest the circadian clock mechanism as a significant modulator of lithium's clinical benefits.
Figures
Similar articles
-
Inositol polyphosphates contribute to cellular circadian rhythms: Implications for understanding lithium's molecular mechanism.Cell Signal. 2018 Apr;44:82-91. doi: 10.1016/j.cellsig.2018.01.001. Epub 2018 Jan 11. Cell Signal. 2018. PMID: 29331582
-
Calcium channel genes associated with bipolar disorder modulate lithium's amplification of circadian rhythms.Neuropharmacology. 2016 Feb;101:439-48. doi: 10.1016/j.neuropharm.2015.10.017. Epub 2015 Oct 22. Neuropharmacology. 2016. PMID: 26476274 Free PMC article.
-
Circadian rhythmicity of active GSK3 isoforms modulates molecular clock gene rhythms in the suprachiasmatic nucleus.J Biol Rhythms. 2015 Apr;30(2):155-60. doi: 10.1177/0748730415573167. Epub 2015 Feb 27. J Biol Rhythms. 2015. PMID: 25724980 Free PMC article.
-
Molecular mechanisms underlying mood stabilization in manic-depressive illness: the phenotype challenge.Am J Psychiatry. 1999 Oct;156(10):1506-14. doi: 10.1176/ajp.156.10.1506. Am J Psychiatry. 1999. PMID: 10518159 Review.
-
Inhibition of glycogen synthase kinase 3 by lithium, a mechanism in search of specificity.Front Mol Neurosci. 2022 Nov 24;15:1028963. doi: 10.3389/fnmol.2022.1028963. eCollection 2022. Front Mol Neurosci. 2022. PMID: 36504683 Free PMC article. Review.
Cited by
-
A Crosstalk between the Biorhythms and Gatekeepers of Longevity: Dual Role of Glycogen Synthase Kinase-3.Biochemistry (Mosc). 2021 Apr;86(4):433-448. doi: 10.1134/S0006297921040052. Biochemistry (Mosc). 2021. PMID: 33941065 Free PMC article. Review.
-
Insulin, insulin-like growth factors and incretins: neural homeostatic regulators and treatment opportunities.CNS Drugs. 2008;22(6):443-53. doi: 10.2165/00023210-200822060-00001. CNS Drugs. 2008. PMID: 18484789 Review.
-
Time-dependent activation of MAPK/Erk1/2 and Akt/GSK3 cascades: modulation by agomelatine.BMC Neurosci. 2014 Oct 21;15:119. doi: 10.1186/s12868-014-0119-1. BMC Neurosci. 2014. PMID: 25332063 Free PMC article.
-
Lithium effects on circadian rhythms in fibroblasts and suprachiasmatic nucleus slices from Cry knockout mice.Neurosci Lett. 2016 Apr 21;619:49-53. doi: 10.1016/j.neulet.2016.02.030. Epub 2016 Feb 27. Neurosci Lett. 2016. PMID: 26930624 Free PMC article.
-
Annual Research Review: Transgenic mouse models of childhood-onset psychiatric disorders.J Child Psychol Psychiatry. 2011 Apr;52(4):442-75. doi: 10.1111/j.1469-7610.2011.02380.x. Epub 2011 Feb 10. J Child Psychol Psychiatry. 2011. PMID: 21309772 Free PMC article. Review.
References
-
- Gould TD, Manji HK. The Wnt signaling pathway in bipolar disorder. Neuroscientist. 2002;8:497–511. - PubMed
LinkOut - more resources
Full Text Sources
Other Literature Sources