. 2007 Apr 1;35(2):881-903.
doi: 10.1016/j.neuroimage.2006.12.029. Epub 2007 Jan 3.

Localization of load sensitivity of working memory storage: quantitatively and qualitatively discrepant results yielded by single-subject and group-averaged approaches to fMRI group analysis

Affiliations

Localization of load sensitivity of working memory storage: quantitatively and qualitatively discrepant results yielded by single-subject and group-averaged approaches to fMRI group analysis

Eva Feredoes et al. Neuroimage. .

Erratum in

  • Neuroimage. 2007 Jul 1;36(3):1056

Abstract

The impetus for the present report is the evaluation of competing claims of two classes of working memory models: Memory systems models hold working memory to be supported by a network of prefrontal cortex (PFC)-based domain-specific buffers that act as workspaces for the storage and manipulation of information; emergent processes models, in contrast, hold that the contributions of PFC to working memory do not include the temporary storage of information. Empirically, each of these perspectives is supported by seemingly mutually incompatible results from functional magnetic resonance imaging (fMRI) studies that either do or do not find evidence for delay-period sensitivity to memory load, an index of storage, in PFC. We hypothesized that these empirical discrepancies may be due, at least in part, to methodological factors, because studies reporting delay-period load sensitivity in PFC typically employ spatially normalized group averaged analyses, whereas studies that do not find PFC load sensitivity typically use a single-subject "case-study" approach. Experiment 1 performed these two approaches to analysis on the same data set, and the results were consistent with our hypothesis. Experiment 2 evaluated one characteristic of the single-subject results from Experiment 1 - considerable topographical variability across subjects - by evaluating its test-retest reliability with a new group of subjects. Each subject was scanned twice, and the results indicated that, for each of several contrasts, test-retest reliability was significantly greater than chance. Together, these results raise the possibility that the brain bases of delay-period load sensitivity may be characterized by considerable intersubject topographical variability. Our results highlight how the selection of fMRI analysis methods can produce discrepant results, each of which is consistent with different, incompatible theoretical interpretations.


Figures
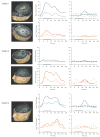
Figure 1
Figure 1
SS and SNGA results from Experiment 1. Regions with load sensitivity detected with SS analysis are shown in blue, along with, plots of the trial-averaged time series extracted from these load-sensitive regions (left column; blue = Forward 5; green = Forward 2), and corresponding relevant information from the solution of the GLM (delay-period covariates scaled by their parameter estimates, and residual error at each time point, right column). The same is shown for the SNGA-derived load regions masks (red brain regions, and corresponding times series and statistical data; red = Forward 5; orange = Forward 2). Note that in the plots of delay effects calculated from SNGA-derived load regions, the maximum excursion of the DelayForward 5 covariates are often not greater than the residual error term from the GLM at the same time point. For clarity, the Euclidean distances between SS and SNGA-derived regions are reported in Table 2.
Figure 1
Figure 1
SS and SNGA results from Experiment 1. Regions with load sensitivity detected with SS analysis are shown in blue, along with, plots of the trial-averaged time series extracted from these load-sensitive regions (left column; blue = Forward 5; green = Forward 2), and corresponding relevant information from the solution of the GLM (delay-period covariates scaled by their parameter estimates, and residual error at each time point, right column). The same is shown for the SNGA-derived load regions masks (red brain regions, and corresponding times series and statistical data; red = Forward 5; orange = Forward 2). Note that in the plots of delay effects calculated from SNGA-derived load regions, the maximum excursion of the DelayForward 5 covariates are often not greater than the residual error term from the GLM at the same time point. For clarity, the Euclidean distances between SS and SNGA-derived regions are reported in Table 2.
Figure 2
Figure 2
Group average time series for Forward 5 and Forward 2 trials extracted from the SNGA PFC ROI.
Figure 3
Figure 3
Measure of overlap of thresholded maps from two separate scanning sessions for each of four contrasts. Top row = intersession data; bottom row = intersubject data. Values indicate the mean number of voxels significantly active at the whole-brain level. The overlapping portion of each chart indicates the proportion of voxels in Session B that were also identified from Session A.
Figure 4
Figure 4
Effect sizes (as mean % signal change) for each contrast-of-interest, extracted from suprathreshold voxels Session A, and from these same voxels from Session B (i.e., A^B). Error bars represent standard errors.

References

    1. Aguirre GK, Zarahn E, D’Esposito M. An area within human ventral cortex sensitive to “building” stimuli: evidence and implications. Neuron. 1998a;21:373–383. - PubMed
    1. Aguirre GK, Zarahn E, D’Esposito M. The variability of human, BOLD hemodynamic responses. NeuroImage. 1998b;8:360–369. - PubMed
    1. Baddeley AD. Working Memory. Oxford University Press; London: 1986.
    1. Baddeley AD. The episodic buffer: a new component of working memory? Trends in Cognitive Sciences. 2000;4:417–423. - PubMed
    1. Baddeley AD, Hitch GJ. Working Memory. In: Bower GH, editor. The Psychology of Learning and Motivation. Academic Press; New York: 1974. pp. 47–89.

Publication types