. 2007 Apr;27(8):2886-96.
doi: 10.1128/MCB.00054-07. Epub 2007 Feb 12.

Regulation of rRNA synthesis by TATA-binding protein-associated factor Mot1

Affiliations

Regulation of rRNA synthesis by TATA-binding protein-associated factor Mot1

Arindam Dasgupta et al. Mol Cell Biol. 2007 Apr.

Abstract

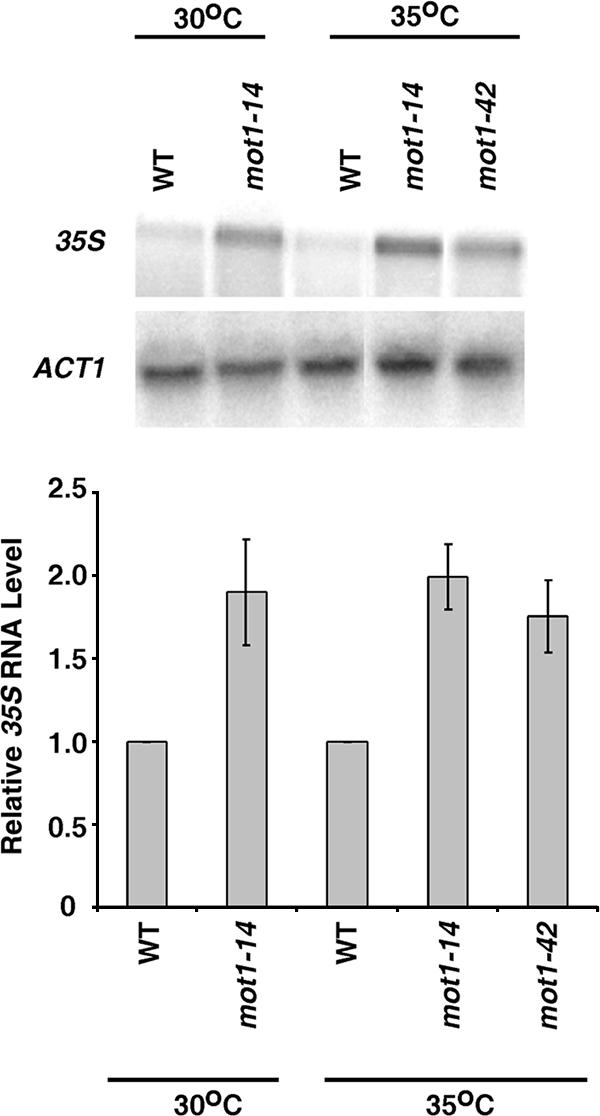
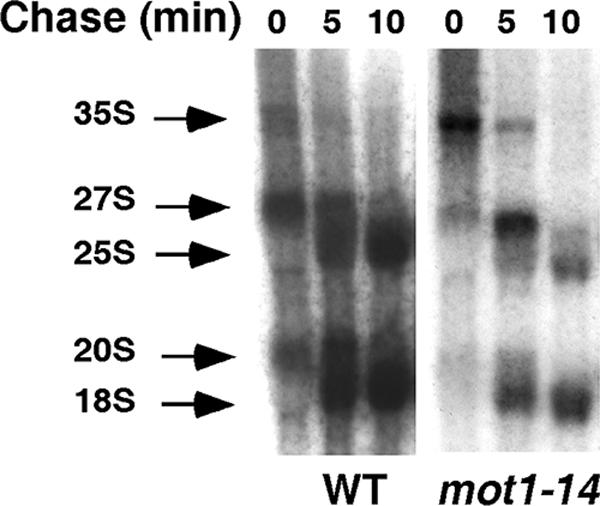
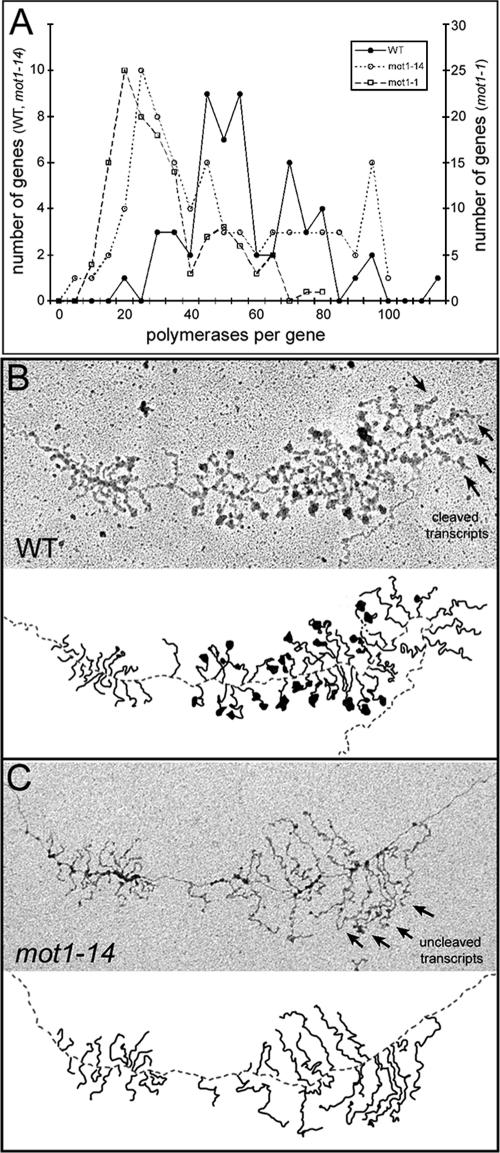
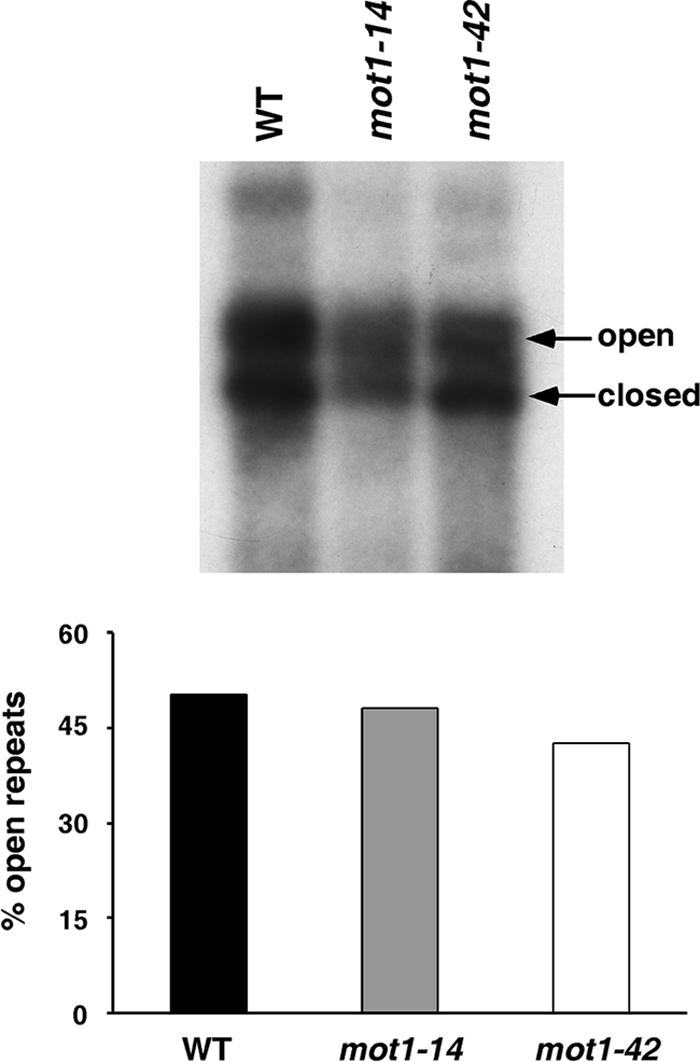
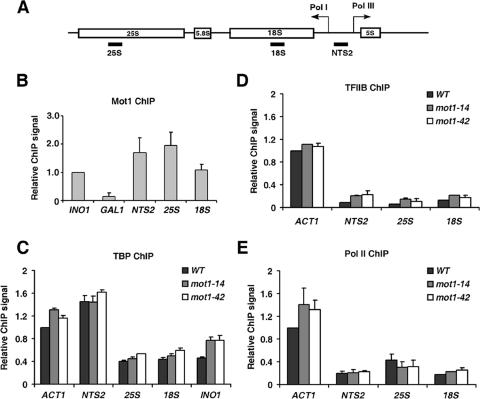
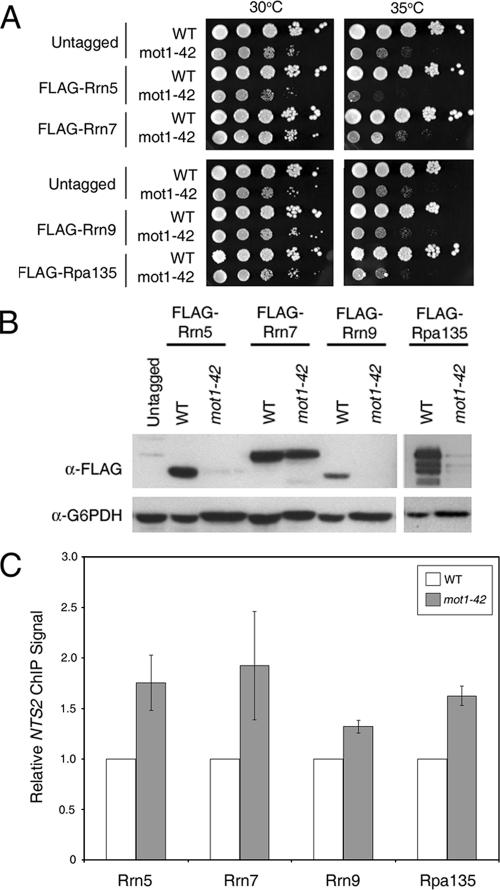
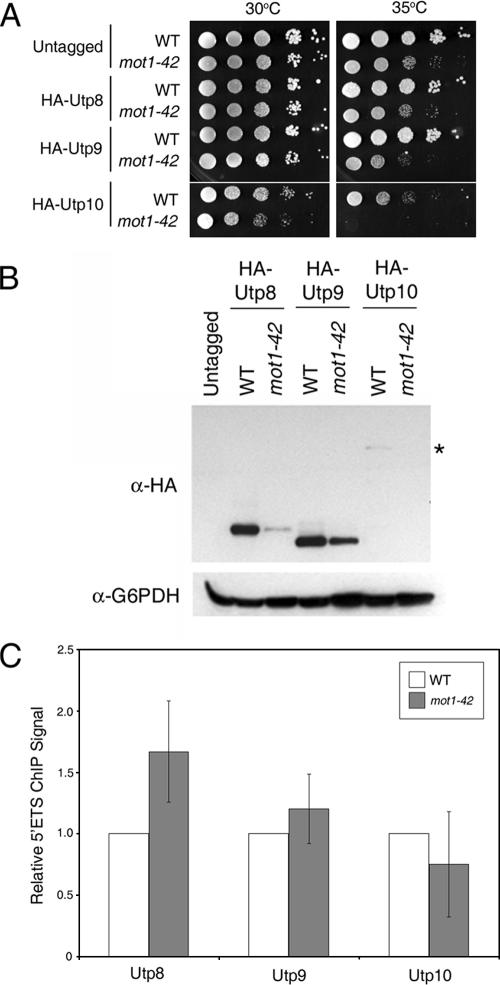
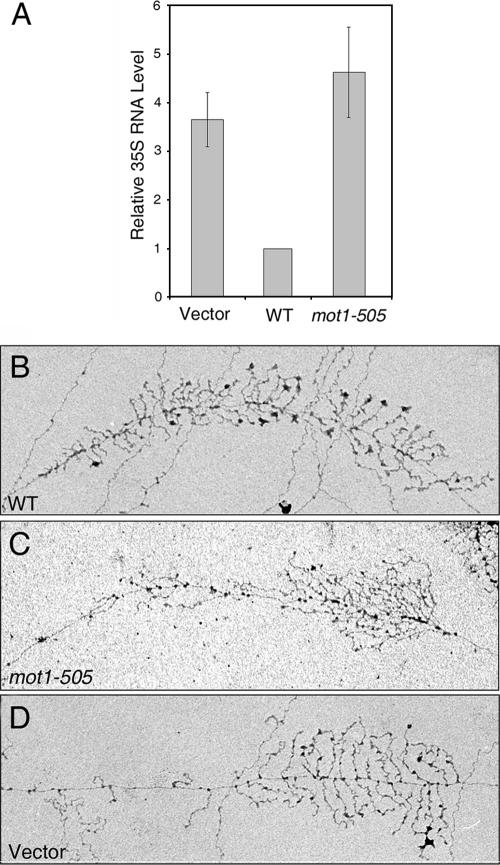
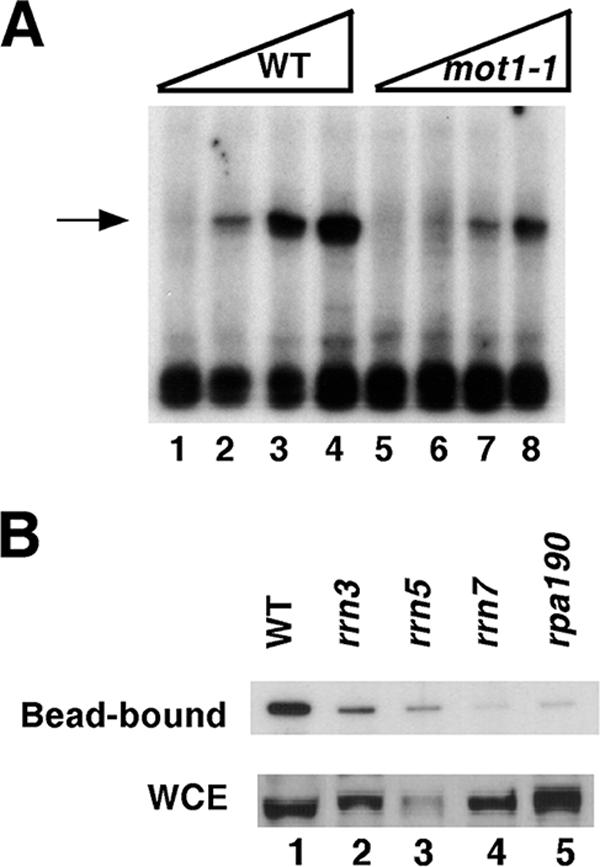
Mot1 is an essential, conserved, TATA-binding protein (TBP)-associated factor in Saccharomyces cerevisiae with well-established roles in the global control of RNA polymerase II (Pol II) transcription. Previous results have suggested that Mot1 functions exclusively in Pol II transcription, but here we report a novel role for Mot1 in regulating transcription by RNA polymerase I (Pol I). In vivo, Mot1 is associated with the ribosomal DNA, and loss of Mot1 results in decreased rRNA synthesis. Consistent with a direct role for Mot1 in Pol I transcription, Mot1 also associates with the Pol I promoter in vitro in a reaction that depends on components of the Pol I general transcription machinery. Remarkably, in addition to Mot1's role in initiation, rRNA processing is delayed in mot1 cells. Taken together, these results support a model in which Mot1 affects the rate and efficiency of rRNA synthesis by both direct and indirect mechanisms, with resulting effects on transcription activation and the coupling of rRNA synthesis to processing.


Figures

FIG. 1.
FIG. 1.
Elevated 35S RNA in mot1 cells. Wild-type (WT) and mot1 cells were grown in rich medium at 30°C to an OD600 of ∼1.0. Cells were then harvested or heat shocked for 45 min at 35°C prior to harvest. Twenty micrograms of total RNA from each strain was resolved by electrophoresis, transferred to a nylon membrane, and probed with a radiolabeled 35S-specific probe. For normalization of the 35S RNA band intensity, the blot was stripped and reprobed for ACT1 message. The graph shows the normalized, relative 35S RNA level determined from three independent experiments ± standard deviation.
FIG. 2.
FIG. 2.
Reduced rRNA synthesis and processing in mot1 cells. Wild-type and mot1-14 cells were grown at 30°C in synthetic medium lacking methionine to an OD600 of ∼0.3 to 0.4. Cells were then pulse-labeled with [methyl-3H]methionine for 2 min (time zero) and then incubated with unlabeled methionine for the times indicated above the lanes prior to harvest. Total RNA was fractionated on a formaldehyde agarose gel, and radiolabeled rRNA species were detected by autoradiography as described in Materials and Methods.
FIG. 3.
FIG. 3.
rRNA genes from mot1 cells display fewer transcripts per gene on average and slowed rRNA processing on those transcripts. (A) Distribution of polymerase density on genes from mot1-14 and mot1-1 strains compared to that for the wild-type control strain. The number of polymerases per gene was determined for 55 rRNA genes from wild-type cells, 75 genes from mot1-14 cells, and 130 genes for mot1-1 cells. (B and C) Electron micrographs of representative rRNA genes from the wild-type (B) or mot1-14 (C) strain, with 55 and 37 transcripts, respectively. Below each gene is an interpretive tracing of the rDNA (dotted line) and RNA transcripts (solid lines). The wild-type gene (B) displays typical cotranscriptional rRNA processing events seen on yeast rRNA genes (43), including formation of large 5′-terminal particles, which encompass the pre-small-subunit RNA, followed by cleavage of these SSU processomes from nascent transcripts (arrows). The mot1-14 rRNA gene (C) displays transcripts that do not acquire SSU processome components and are not cleaved while nascent (arrows), characteristic of slowed or delayed rRNA processing.
FIG. 4.
FIG. 4.
The number of active rDNA repeats is the same in wild-type and mot1 cells. Psoralen cross-linking of the ribosomal DNA slows migration of the actively transcribed repeats. Wild-type (WT), mot1-14, and mot1-42 cells were harvested in log phase and then psoralen and UV treated as described in Materials and Methods. Genomic DNA preps were then digested with EcoRI, resolved on a 1.3% agarose-Tris-borate-EDTA gel, transferred to a membrane, and probed with a 35S rDNA fragment. The actively transcribed repeats (open) and the inactive repeats (closed) are indicated on the blot; the percentages of open repeats are indicated in the bar graph.
FIG. 5.
FIG. 5.
Mot1 is localized to rDNA. (A) Schematic representation of the rDNA in S. cerevisiae showing the initiation site and direction of 35S transcription by Pol I (arrow). Relative positions of NTS2, 18S, and 25S DNA amplified in ChIP experiments are shown by black bars. (B) ChIP analysis of Mot1-Myc binding to the indicated chromosomal loci. Relative ChIP signal obtained from three experiments is shown, normalized to the level of Mot1 associated with the Mot1-repressed INO1 promoter (1.0). The GAL1 promoter is a negative control. Note that in this and other ChIP experiments, PCR of rDNA was performed for 22 cycles whereas PCR of single-copy Pol II promoters (INO1 and GAL1 in this case) was performed for 27 cycles; these represent the midpoints of the linear response range of the ChIP assay. (C) TBP ChIP was performed using chromatin from wild-type (WT), mot1-14, or mot1-42 cells. TBP occupancy of the indicated loci is shown relative to that of the ACT1 promoter in wild-type cells (1.0). The data represent the mean values ± standard deviation determined from two experiments. (D) ChIP was performed for TFIIB as for panel C. (E) ChIP was performed as for panel C to determine the relative Pol II large subunit association with the indicated chromosomal regions. Each result represents the mean ± standard deviation obtained from two experiments using independently prepared chromatin samples.
FIG. 6.
FIG. 6.
Recruitment of UAFs and the CF complex is enhanced in mot1 cells. (A) Serial dilution spot assays of strains expressing the indicated FLAG-tagged proteins in WT and mot1-42 cells. The YPD (rich medium) plates were incubated at the indicated temperatures for 2 days prior to photography. (B) Western blot showing protein levels in WT or mot1-42 cells. Protein levels (with the exception of Rrn7, which is unaffected) are decreased in mot1 cells. (C) Quantification of ChIP to NTS2 (region of DNA amplification shown in Fig. 5). Recruitment of both UAFs and the CF complex are modestly increased in mot1 cells. Note that the significant decrease in protein levels does not affect the ability for these proteins to be recruited for transcription.
FIG. 7.
FIG. 7.
Recruitment of SSU processome components to chromatin is not impaired in mot1 cells. (A) Spot assay showing growth of 10-fold serial dilutions with HA-tagged Utps in WT and mot1-42 strains. HA-Utp10 cells show a severe synthetic defect with mot1-42. (B) Western blot detecting Utp levels in WT and mot1-42 strains. Mot1 affects the expression level of all three Utps tested. The asterisk indicates the position of Utp10, which is expressed at low levels even in WT cells. (C) Quantification of Utp ChIP results. Graph shows the mean value ± standard deviation obtained using two independently prepared batches of chromatin. Note that the extent of Utp association with chromatin is not dependent on the overall protein level in the whole-cell extracts.
FIG. 8.
FIG. 8.
Mot1 ATPase activity is required for proper transcription of 35S RNA. (A) Results of Northern analysis showing relative 35S RNA levels in each of three strains. mot1-1 cells were transformed with vector plasmid or plasmids carrying the wild-type (WT) MOT1 or mot1-505 (DEAD box mutant) genes, and Northern analysis was performed as for Fig. 1. Relative 35S RNA levels were normalized to ACT1 message levels in each strain. The graph shows the average ± standard deviation obtained from two independent experiments. (B to D) Electron micrographs of rDNA from mot1-1 cells transformed with a wild-type MOT1 (B), mot1-505 (C), or vector (D) plasmid. Note that the lower number of transcripts and defects in cotranscriptional processing seen with the vector-carrying strain were recovered only by coexpression of wild-type MOT1 but not mot1-505, which is defective for Mot1 ATPase activity.
FIG. 9.
FIG. 9.
In vitro recruitment of Mot1 to the Pol I promoter depends on CF and RNA polymerase I. (A) In vitro transcription analysis using whole-cell extracts from wild-type (WT) or mot1-1 cells was performed using identical volumes of extract (0.5, 1, 2, or 4 μl, indicated by the ramps) obtained from identical numbers of cells prepared in parallel (see Materials and Methods and reference 3). Note the decrease in Pol I transcript levels directed by extracts from mot1-1 cells compared to those for wild-type cells. (B) Whole-cell extracts from the indicated strains were incubated for 1 h at room temperature with a Pol I promoter fragment immobilized on magnetic beads. After extensive washing, the beads were boiled in SDS sample buffer and promoter-bound Mot1 was detected by Western blotting (“bead-bound” samples). The relative level of Mot1 in the starting extracts is shown in the lower panel (WCE [whole-cell extract]). Note that Mot1 binding to the Pol I promoter was readily detected using extract from wild-type cells and that this interaction was strongly dependent on Pol I and Rrn7 and markedly reduced in the absence of Rrn3.

Similar articles

Cited by

References

    1. Andrau, J.-C., C. J. C. Van Oevelen, H. A. A. M. Van Teeffelen, P. A. Weil, F. C. P. Holstege, and H. T. M. Timmers. 2002. Mot1p is essential for TBP recruitment to selected promoters during in vivo gene activation. EMBO J. 21:5173-5183. - PMC - PubMed
    1. Angermayr, M., U. Oechsner, and W. Bandlow. 2003. Reb1p-dependent DNA bending effects nucleosome positioning and constitutive transcription at the yeast profilin promoter. J. Biol. Chem. 278:17918-17926. - PubMed
    1. Aprikian, P., B. Moorefield, and R. H. Reeder. 2001. New model for the yeast RNA polymerase I transcription cycle. Mol. Cell. Biol. 21:4847-4855. - PMC - PubMed
    1. Auble, D. T., K. E. Hansen, C. G. F. Mueller, W. S. Lane, J. Thorner, and S. Hahn. 1994. Mot1, a global repressor of RNA polymerase II transcription, inhibits TBP binding to DNA by an ATP-dependent mechanism. Genes Dev. 8:1920-1934. - PubMed
    1. Auble, D. T., D. Wang, K. W. Post, and S. Hahn. 1997. Molecular analysis of the SNF2/SWI2 protein family member MOT1, an ATP-driven enzyme that dissociates TATA-binding protein from DNA. Mol. Cell. Biol. 17:4842-4851. - PMC - PubMed

Publication types

MeSH terms