. 2007 Apr;27(8):3165-75.
doi: 10.1128/MCB.01315-06. Epub 2007 Feb 12.

Constitutively active type I insulin-like growth factor receptor causes transformation and xenograft growth of immortalized mammary epithelial cells and is accompanied by an epithelial-to-mesenchymal transition mediated by NF-kappaB and snail

Affiliations

Constitutively active type I insulin-like growth factor receptor causes transformation and xenograft growth of immortalized mammary epithelial cells and is accompanied by an epithelial-to-mesenchymal transition mediated by NF-kappaB and snail

Hyun-Jung Kim et al. Mol Cell Biol. 2007 Apr.

Abstract

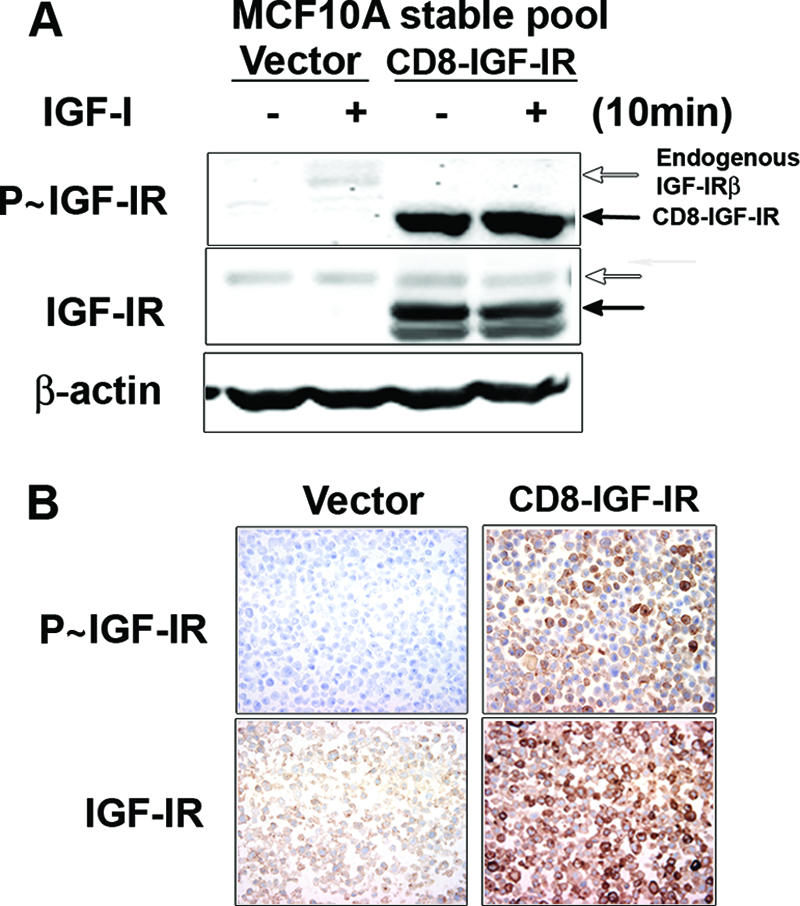
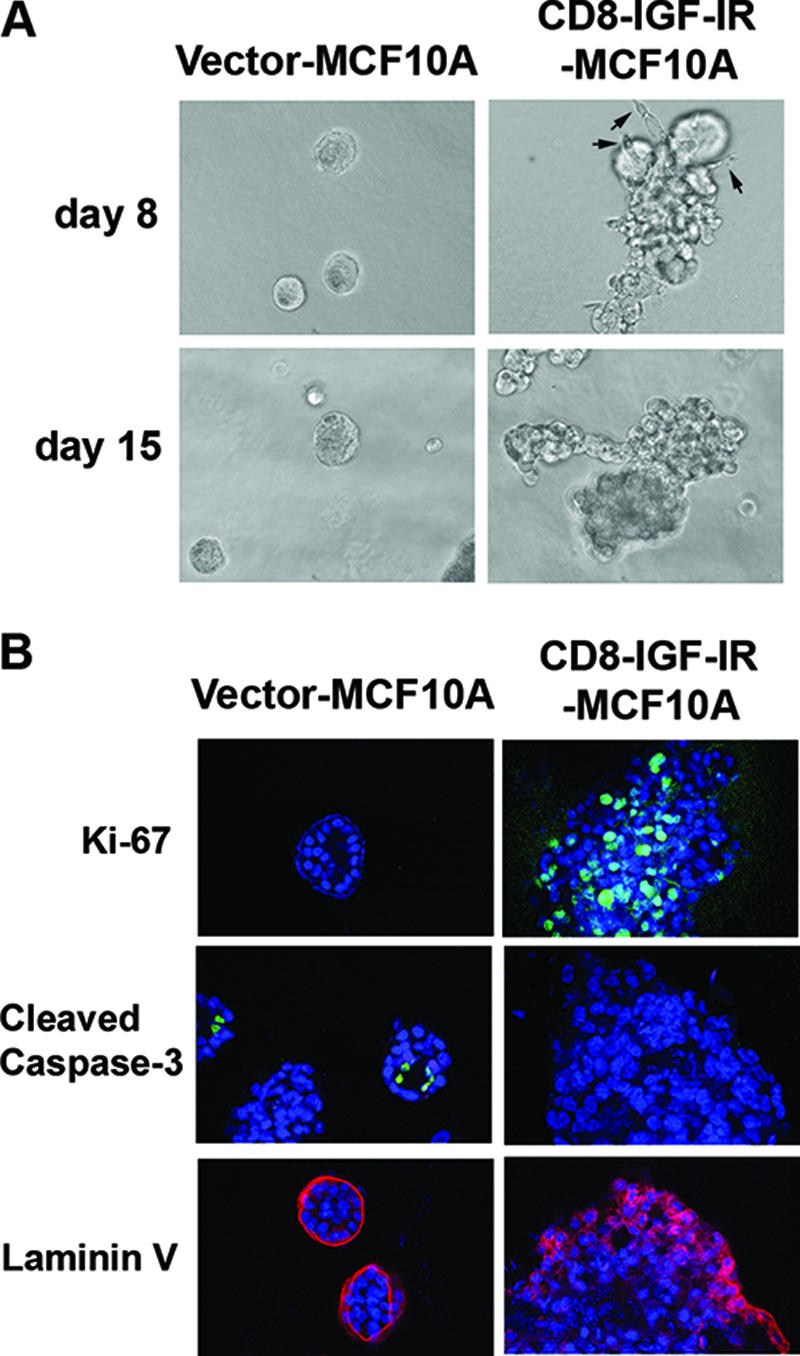
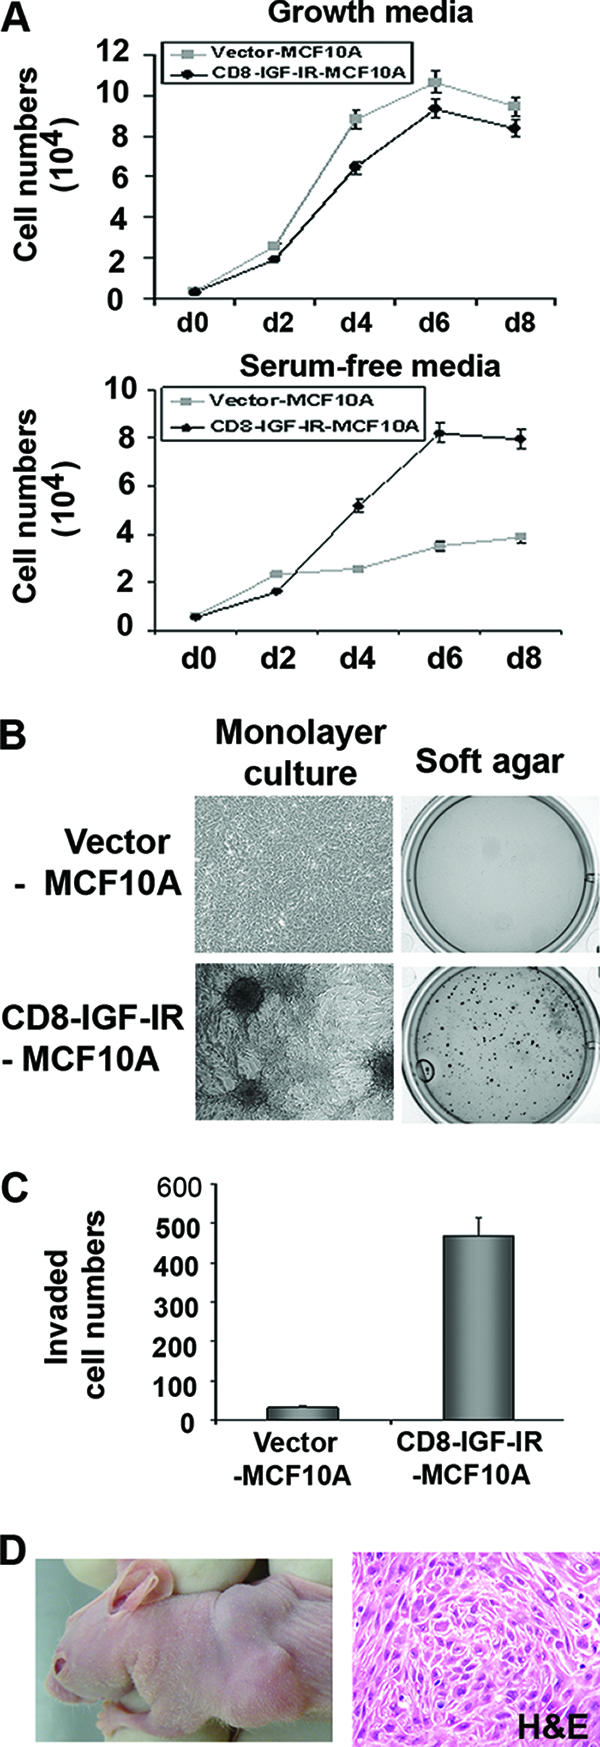
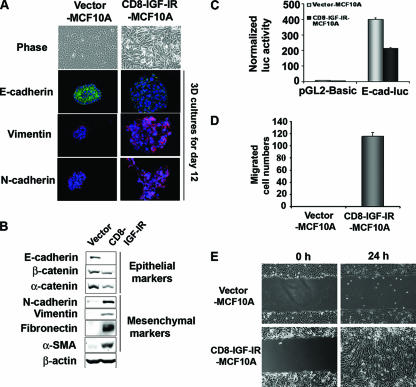
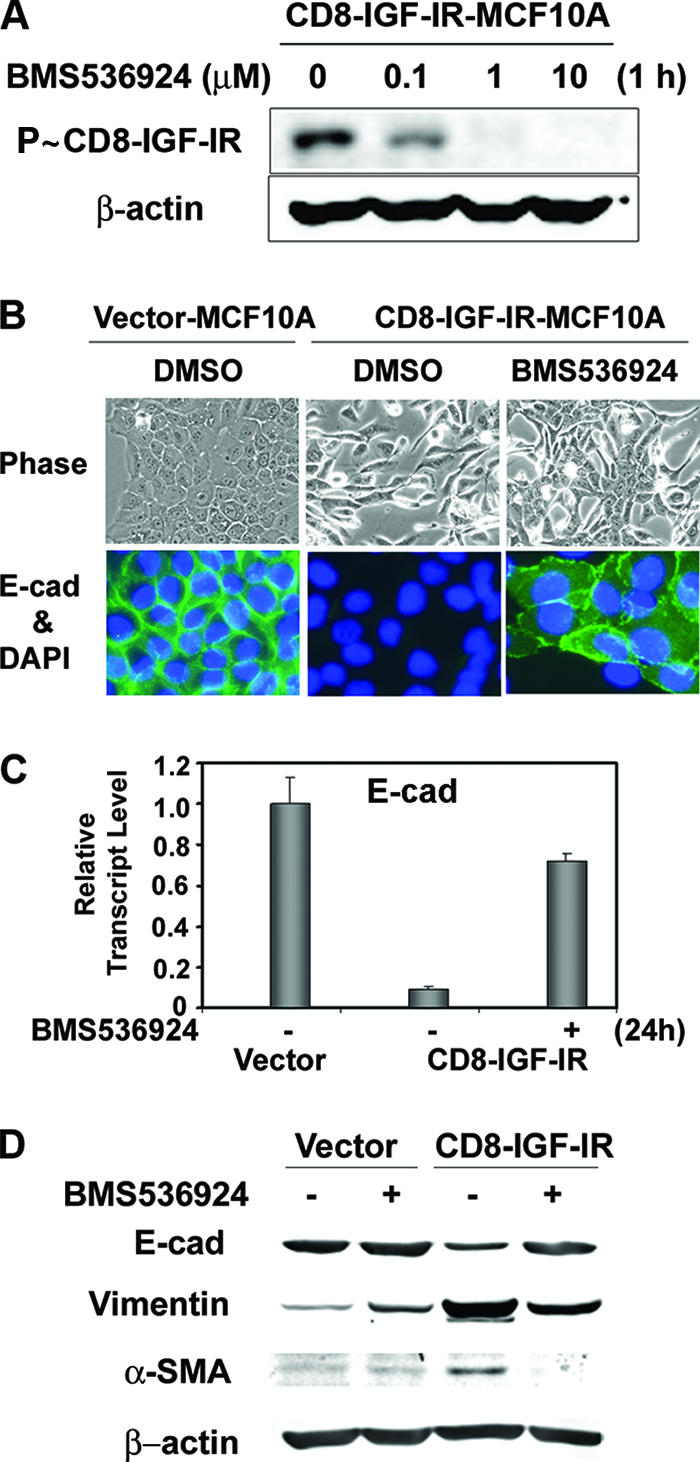
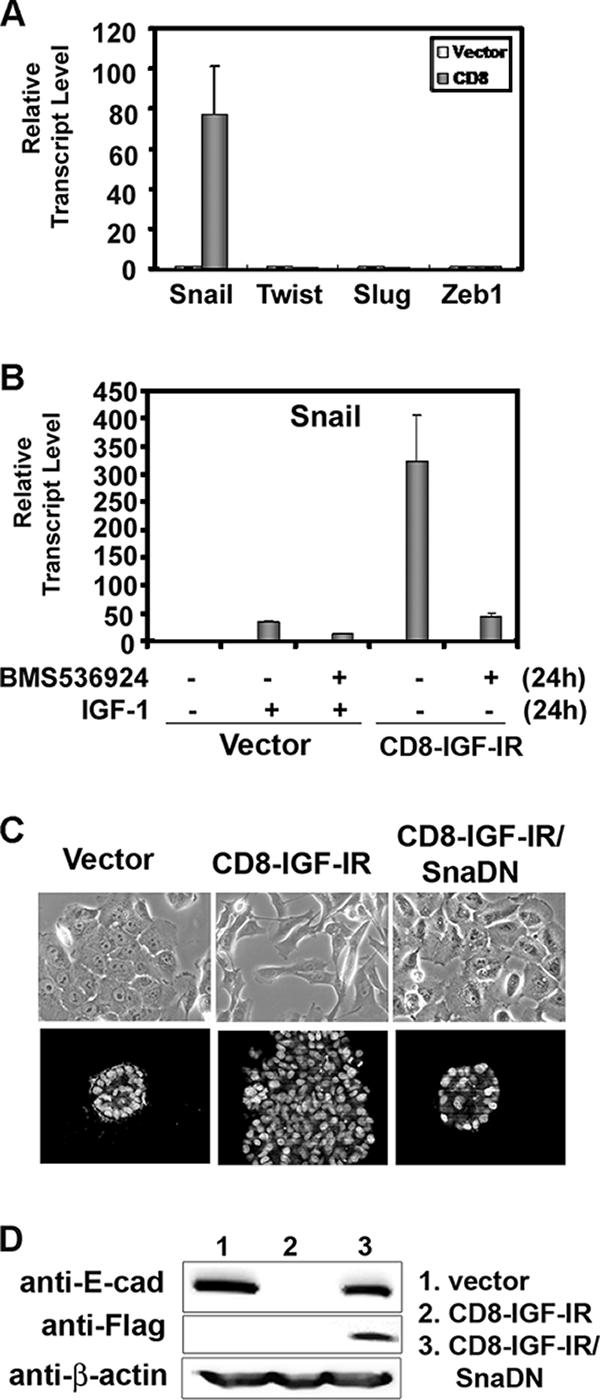
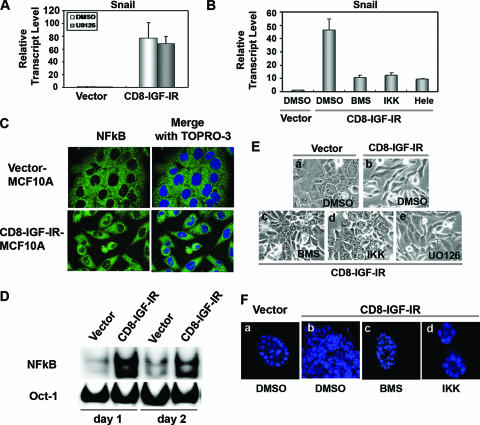
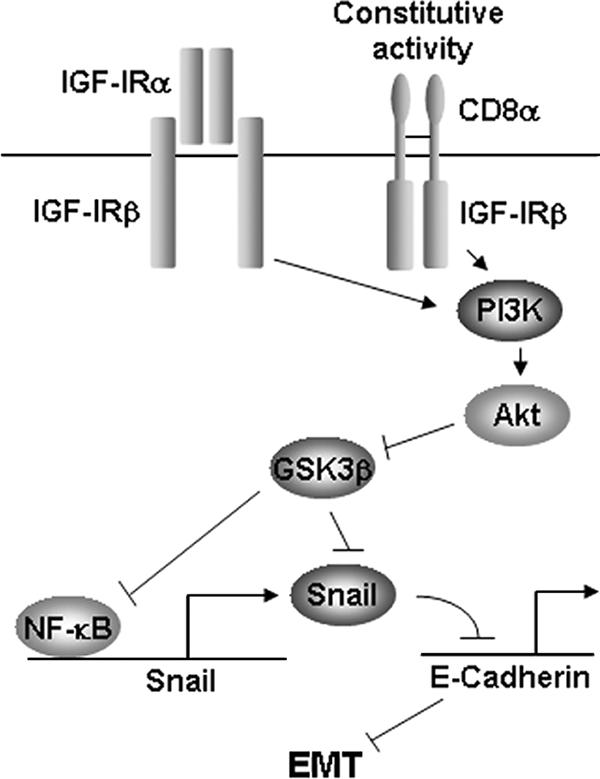
Type I insulin-like growth factor receptor (IGF-IR) can transform mouse fibroblasts; however, little is known about the transforming potential of IGF-IR in human fibroblasts or epithelial cells. We found that overexpression of a constitutively activated IGF-IR (CD8-IGF-IR) was sufficient to cause transformation of immortalized human mammary epithelial cells and growth in immunocompromised mice. Furthermore, CD8-IGF-IR caused cells to undergo an epithelial-to-mesenchymal transition (EMT) which was associated with dramatically increased migration and invasion. The EMT was mediated by the induction of the transcriptional repressor Snail and downregulation of E-cadherin. NF-kappaB was highly active in CD8-IGF-IR-MCF10A cells, and both increased levels of Snail and the EMT were partially reversed by blocking NF-kappaB or IGF-IR activity. This study places IGF-IR among a small group of oncogenes that, when overexpressed alone, can confer in vivo tumorigenic growth of MCF10A cells and indicates the hierarchy in the mechanism of IGF-IR-induced EMT.


Figures

FIG. 1.
FIG. 1.
Establishment of MCF10A stable cell lines overexpressing CD8-IGF-IR. (A) Vector-MCF10A and CD8-IGF-IR-MCF10A pools were incubated in SFM for 24 h and then stimulated with IGF-I (10 nM) for 10 min. Forty-microgram amounts of cell lysates were immunoblotted with anti-pY-IGF-IR (P∼IGF-IR) or total IGF-IRβ antibodies. The open and black arrows indicate endogenous IGF-IRβ and CD8-IGF-IR, respectively. β-Actin was used as a loading control. − and + indicate the absence or presence of IGF-I. (B) Vector-MCF10A and CD8-IGF-IR-MCF10A cells were cultured in SFM, harvested, and processed in paraffin. Five-micrometer sections were then processed for IHC using anti-pY-IGF-IR (P∼IGF-IR) or total IGF-IRβ antibodies.
FIG. 2.
FIG. 2.
Constitutively active IGF-IR disrupted acinar morphogenesis of MCF10A cells on 3D Matrigel culture. (A) Vector-MCF10A and CD8-IGF-IR-MCF10A cells were plated in Matrigel and cultured for 8 days or 15 days. Phase-contrast images of acini are shown in ×20 magnification. The arrow indicates invasive protrusions. (B) The cells were cultured on Matrigel for 8 to 12 days and then stained with antibodies to Ki-67 (green), cleaved caspase-3 (green) or laminin V (red). The nuclei (blue) were labeled with TOPRO-3 and visualized by confocal microscopy with ×40 magnification.
FIG. 3.
FIG. 3.
Constitutive IGF-IR activation induced cellular transformation of nontransformed MCF10A cells. (A) Vector-MCF10A and CD8-IGF-IR-MCF10A cells were plated on 12-well plates, and the next day, the medium was changed for serum-free medium to compare the growth rates of these cells in serum-free conditions. The next day after plating was designated day 0 (d0). Cell numbers were counted every 2 days. The error bars represent the standard errors of the means. (B) For monolayer culture, 2 × 10⁵ cells were plated on 6-well plates and cultured for 10 days. Phase-contrast images of focus formation at day 10 are shown in the left panels. For the anchorage-independent growth assay, 1 × 10⁴ cells were suspended in their growth medium containing 0.35% agarose and plated on 6-well plates over a basal layer of complete medium containing 0.7% agarose. Two weeks later, colonies were stained with MTT (right panels). (C) The Matrigel invasion assay showed that the number of CD8-IGF-IR-MCF10A cells that penetrated the membrane was significantly higher than that of vector-MCF10A cells. Cells were counted in four different microscopic fields (×10 magnification). The error bars represent the standard errors of the means. (D) Six-week-old mice were injected with CD8-IGF-IR-MCF10A cells in the number 3 mammary gland. The left panel is a representative photograph of a xenograft at 15 days after injection. The right panel is a representative section of tumor stained with hematoxylin and eosin.
FIG. 4.
FIG. 4.
EMT was induced in CD8-IGF-IR-MCF10A cells. (A) The morphologies of MCF10A cells expressing either the control vector or CD8-IGF-IR were revealed by phase-contrast microscopy (×20 magnification) at day 3. Vector-MCF10A and CD8-IGF-IR-MCF10A cells were cultured on Matrigel for 12 days and then stained with antibodies to E-cadherin (green), vimentin (red), or N-cadherin (red). The nuclei (blue) were labeled with TOPRO-3 and visualized by confocal microscopy with ×40 magnification. (B) Levels of epithelial proteins, including E-cadherin, β-catenin, and α-catenin, and mesenchymal proteins, including N-cadherin, vimentin, fibronectin, and α-SMA, in vector-MCF10A and CD8-IGF-IR-MCF10A cells were examined by immunoblotting. β-Actin was used as a loading control. (C) The activity of a 2-kb fragment of the E-cadherin promoter upstream of a luciferase reporter (E-cad-luc) was compared to that of the control plasmid (pGL2-basic) by transient transfection. The luciferase (luc) activity was normalized to the cotransfected β-galactosidase activity. The error bars represent the standard errors of the means. (D) Results of the transwell migration assay in which vector-MCF10A and CD8-IGF-IR-MCF10A cells were induced to migrate toward growth media. The migrated cells that passed through the membrane to the lower surface were counted in four different microscopic fields at ×10 magnification. (E) Confluent vector-MCF10A and CD8-IGF-IR-MCF10A cells were scratched and photographs were taken immediately (0 h) and 24 h postscratch at ×10 magnification.
FIG. 5.
FIG. 5.
Blocking of constitutive IGF-IR activation by a new small-molecule inhibitor of IGF-IR, BMS-536924, partially reversed the mesenchyme-like morphological changes and the downregulation of E-cadherin levels. (A) CD8-IGF-IR-MCF10A cells were incubated with the indicated concentration of BMS-536924 for 1 h after 16 h of serum starvation, and the phosphorylation of CD8-IGF-IR was analyzed by immunoblotting with anti-P∼IGF-IR antibody. β-Actin was used as a loading control. (B) Vector-MCF10A and CD8-IGF-IR-MCF10A cells were incubated with or without 1 μM BMS-536924 for 24 h and were either visualized by phase-contrast microscopy at ×20 magnification (upper panels) or stained with E-cadherin (E-cad) (×40 magnification; green) (lower panels). The nuclei were stained with 4′,6′-diamidino-2-phenylindole (DAPI). DMSO, dimethyl sulfoxide. (C) Vector-MCF10A and CD8-IGF-IR-MCF10A cells were incubated with (+) or without (−) 1 μM BMS-536924 for 24 h in growth media. The levels of E-cadherin mRNA were examined by Q-PCR. The results are presented as relative transcript levels compared to vector-MCF10A by using the ΔΔCT method, with β-actin mRNA levels used as the normalization control. The error bars represent the standard errors of the means. (D) Vector-MCF10A and CD8-IGF-IR-MCF10A cells were incubated with (+) or without (−) BMS-536924 for 24 h and lysed, and the levels of epithelial (E-cadherin) or mesenchymal markers (vimentin and α-SMA) were measured. β-Actin was used as a loading control.
FIG. 6.
FIG. 6.
Snail is the essential mediator of the EMT induced by the constitutively active IGF-IR signaling. (A) The expression of Snail, Slug, Twist, and Zeb1 mRNA in vector-MCF10A (open bar) and CD8-IGF-IR-MCF10A (shaded bar) cells was examined by Q-PCR. The results are presented as transcript levels relative to the level in vector-MCF10A cells by using the ΔΔCT method, with β-actin mRNA levels used as the normalization control. (B) Vector-MCF10A and CD8-IGF-IR-MCF10A cells were incubated with (+) or without (−) 100 ng/ml IGF-I and 1 μM BMS-536924 for 24 h in growth media. The expression of Snail mRNA was examined by Q-PCR as described in Materials and Methods. The values shown are relative to those of vector-MCF10A cells without IGF-I stimulation. The error bars represent the standard errors of the means. (C) Vector-MCF10A, CD8-IGF-IR-MCF10A, and CD8-IGF-IR/SnaDN-MCF10A cells were grown in their growth media for 2 days. The cells were visualized by phase-contrast microscopy at ×20 magnification (upper panels). The cells were cultured on Matrigel for 8 days, and then the nuclei were labeled with TOPRO-3 and visualized by confocal microscopy with ×40 magnification (lower panels). (D) Vector-MCF10A, CD8-IGF-IR-MCF10A, and CD8-IGF-IR/SnaDN-MCF10A cells were immunoblotted for E-cadherin (E-cad) and Flag. β-Actin was used as a loading control.
FIG. 7.
FIG. 7.
NF-κB is the upstream regulator of Snail in CD8-IGF-IR-induced EMT. (A) Vector-MCF10A and CD8-IGF-IR-MCF10A cells were incubated with dimethyl sulfoxide (DMSO) (open bars) or 10 μM U0126 (shaded bars) for 24 h, and then Snail mRNA levels were measured by Q-PCR as described in Materials and Methods. Representative levels are compared to those of vector-MCF10A cells incubated with DMSO. The bars represent the averages ± standard errors of the means of three measurements. (B) Vector-MCF10A and CD8-IGF-IR-MCF10A cells were plated and the next day, cells were incubated with or without 1 μM BMS-536924 (BMS) and two NF-κB pathway inhibitors, including 20 μM IKK inhibitor II (IKK) and 20 μM Helenalin (Hele), for 24 h. Snail mRNA levels were measured by Q-PCR as described above for panel A. DMSO was used as the vehicle for the reagents. The transcript levels are relative to the level in vector-MCF10A cells incubated with DMSO. The bars represent the averages ± standard errors of the means of three measurements. (C) The cells were cultured for 2 days and then stained with anti-NF-κB p65 antibody (green). The nuclei (blue) were stained with TOPRO-3 and visualized by confocal microscopy (×60 magnification with oil). (D) The cells were harvested at day 1 or day 2, and nuclear extracts were prepared and incubated with oligonucleotides corresponding to NF-κB or OCt-1 consensus sequences. OCt-1 binding was used as a loading control. (E) Vector-MCF10A (a) and CD8-IGF-IR-MCF10A (b to e) cells were incubated with DMSO (a and b), BMS-536924 (c), 20 μM IKK inhibitor II (d), or 10 μM U0126 (e) for 24 h, and photographs were taken with phase-contrast microscopy at ×20 magnification. (F) Vector-MCF10A (a) and CD8-IGF-IR-MCF10A (b to d) cells were grown in 3D Matrigel and then incubated with DMSO (a and b), 1 μM BMS (c), or 20 μM IKK inhibitor II (d). They were harvested at day 12 and then stained with TOPRO-3 for nuclear staining.
FIG. 8.
FIG. 8.
Schematic indicating how CD8-IGF-IR leads to EMT. This model is based upon studies presented in this report indicating that CD8-IGF-IR induces NF-κB, Snail, repression of E-cadherin mRNA and protein levels, and subsequently, EMT. The hierarchy is shown by the reversion of Snail mRNA levels and EMT by IGF-IR or NF-κB inhibitors. The model is supported by studies showing that IGF-IR activates Akt to repress GSK-3β, GSK-3β is a repressor of NF-κB activity and Snail mRNA and protein levels, IGF-IR activates NF-κB, and NF-κB binds the Snail promoter and increases Snail mRNA levels. PI3K, phosphatidylinositol 3-kinase.

Similar articles

Cited by

References

    1. Bachelder, R. E., S. O. Yoon, C. Franci, A. G. de Herreros, and A. M. Mercurio. 2005. Glycogen synthase kinase-3 is an endogenous inhibitor of Snail transcription: implications for the epithelial-mesenchymal transition. J. Cell Biol. 168:29-33. - PMC - PubMed
    1. Bakin, A. V., A. K. Tomlinson, N. A. Bhowmick, H. L. Moses, and C. L. Arteaga. 2000. Phosphatidylinositol 3-kinase function is required for transforming growth factor beta-mediated epithelial to mesenchymal transition and cell migration. J. Biol. Chem. 275:36803-36810. - PubMed
    1. Barbera, M. J., I. Puig, D. Dominguez, S. Julien-Grille, S. Guaita-Esteruelas, S. Peiro, J. Baulida, C. Franci, S. Dedhar, L. Larue, and A. Garcia de Herreros. 2004. Regulation of Snail transcription during epithelial to mesenchymal transition of tumor cells. Oncogene 23:7345-7354. - PubMed
    1. Barrallo-Gimeno, A., and M. A. Nieto. 2005. The Snail genes as inducers of cell movement and survival: implications in development and cancer. Development 132:3151-3161. - PubMed
    1. Baserga, R. 1999. The IGF-I receptor in cancer research. Exp. Cell Res. 253:1-6. - PubMed

Publication types

MeSH terms