Comparative Study
. 2007 Feb 19;204(2):381-91.
doi: 10.1084/jem.20061338. Epub 2007 Feb 12.

The Wiskott-Aldrich syndrome protein is required for the function of CD4(+)CD25(+)Foxp3(+) regulatory T cells

Affiliations
Comparative Study

The Wiskott-Aldrich syndrome protein is required for the function of CD4(+)CD25(+)Foxp3(+) regulatory T cells

Michel H Maillard et al. J Exp Med. .

Abstract

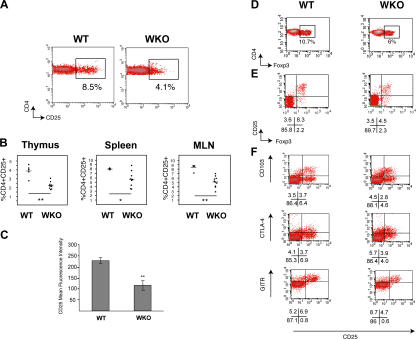
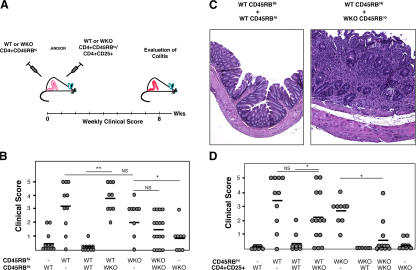
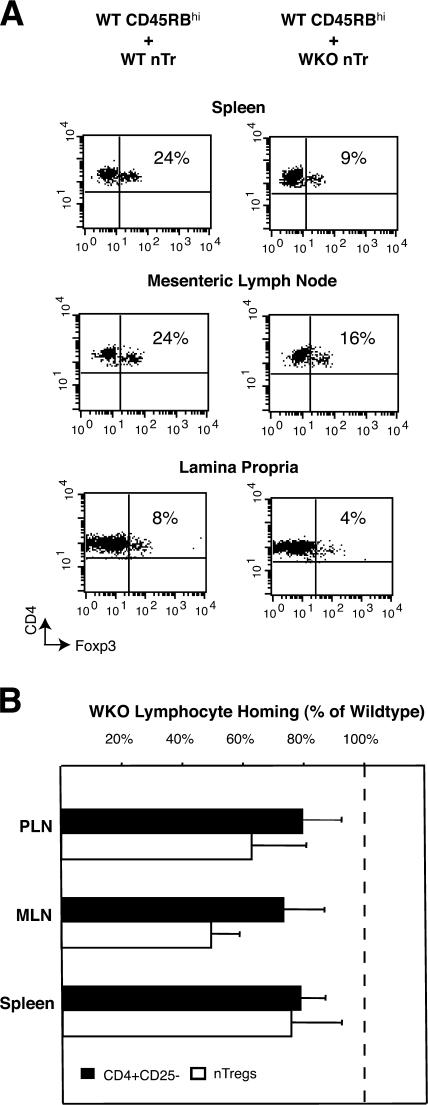
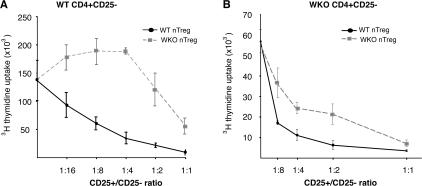
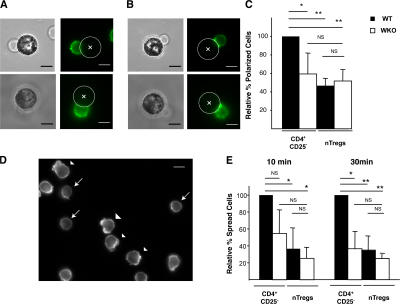
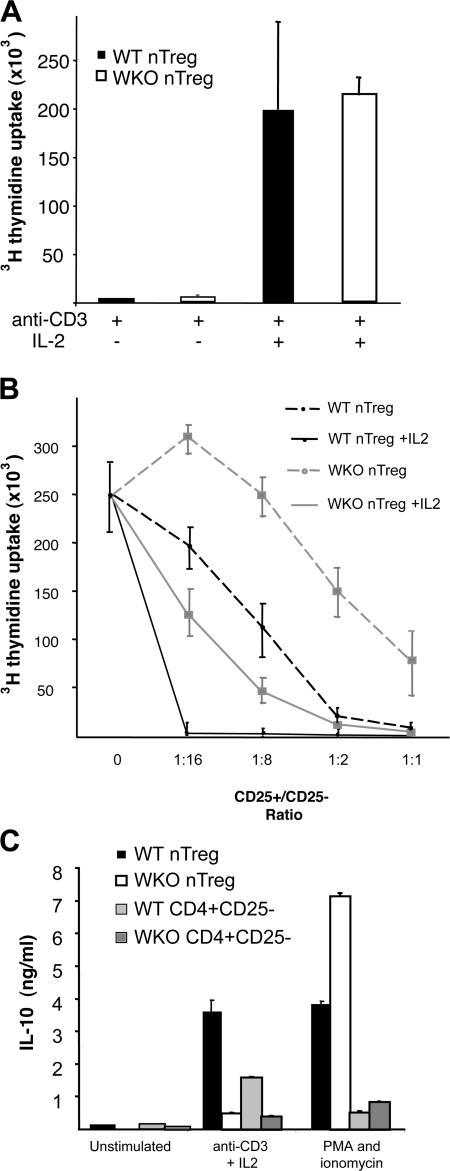
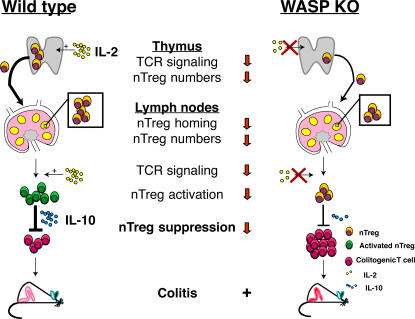
The Wiskott-Aldrich syndrome, a primary human immunodeficiency, results from defective expression of the hematopoietic-specific cytoskeletal regulator Wiskott-Aldrich syndrome protein (WASP). Because CD4(+)CD25(+)Foxp3(+) naturally occurring regulatory T (nTreg) cells control autoimmunity, we asked whether colitis in WASP knockout (WKO) mice is associated with aberrant development/function of nTreg cells. We show that WKO mice have decreased numbers of CD4(+)CD25(+)Foxp3(+) nTreg cells in both the thymus and peripheral lymphoid organs. Moreover, we demonstrate that WKO nTreg cells are markedly defective in both their ability to ameliorate the colitis induced by the transfer of CD45RB(hi) T cells and in functional suppression assays in vitro. Compared with wild-type (WT) nTreg cells, WKO nTreg cells show significantly impaired homing to both mucosal (mesenteric) and peripheral sites upon adoptive transfer into WT recipient mice. Suppression defects may be independent of antigen receptor-mediated actin rearrangement because both WT and WKO nTreg cells remodeled their actin cytoskeleton inefficiently upon T cell receptor stimulation. Preincubation of WKO nTreg cells with exogenous interleukin (IL)-2, combined with antigen receptor-mediated activation, substantially rescues the suppression defects. WKO nTreg cells are also defective in the secretion of the immunomodulatory cytokine IL-10. Overall, our data reveal a critical role for WASP in nTreg cell function and implicate nTreg cell dysfunction in the autoimmunity associated with WASP deficiency.


Figures

Figure 1.
Figure 1.
WKO mice have reduced CD4+CD25+Foxp3+ regulatory T cell numbers. (A) Flow cytometric analysis of CD4 and CD25 expression on WT (left) and WKO (right) splenocytes within a CD4+ lymphocyte gate. Numbers indicate the percentage of CD25+ cells in the indicated gate. Shown are FACS profiles representative of 18 WT and 24 WKO mice on the 129SvEv background. (B) Percentage of CD4+CD25+ T cells within the CD4+ gate in the spleen (left), mesenteric lymph node (MLN; middle), and inside a CD4+CD8 single positive thymocyte gate (right). The horizontal gray bars represent the average. Shown are results of one of five independent experiments. (C) Average mean fluorescence intensity of CD25 of WT (left; n = 5) and WKO (right; n = 9) CD4+CD25+ splenocytes. Error bars represent standard deviations. (D) Decreased percentage of CD4+Foxp3+ cells in WKO mice. Shown are density plots of CD4 and Foxp3 expression in WT (left) and WKO (right) CD4+ lymphocytes (mesenteric lymph node). Numbers indicate the percentage of Foxp3+ cells in the indicated gate. FACS profiles shown are representative of >10 mice in each group. (E) Dot plots of CD25 and Foxp3 expression in CD4+ T cells from WT (left) and WKO mice (right). Shown are representative profiles from the mesenteric lymph node (similar results were obtained in the spleen). Numbers represent the percentage of cells in the corresponding quadrant. Data shown is representative of analysis of 10 individual mice (129SvEv) in each group. (F) Density plots of CD25 and CD103, CTLA-4, or GITR expression on CD4+ splenocytes from WT (left) and WKO (right) mice. Numbers represent the percentage of cells inside the corresponding quadrants. Shown are data representative of 8 WT and 12 WKO mice. *, P < 0.05; **, P < 0.01.
Figure 2.
Figure 2.
WKO nTreg cells fail to suppress colitis induction in the CD45RB transfer model. (A) WT or WKO CD4+CD45RBhi T cells were injected alone or together with WT or WKO CD4+CD45RBlo T cells into SCID mice at day 0. Mice were assessed clinically weekly for a total of 8–12 wk followed by histological analysis. In a different set of experiments, CD4+CD25+ T cells were used instead of CD4+CD45RBlo T cells. (B) Clinical score of colitis 8 wk after transfer of WT or WKO CD4+CD45RBhi T cells and WT or WKO CD4+CD45RBlo T cells. Each dot represents an individual mouse. Horizontal bars represent average. Shown are combined data of four independent experiments. (C) Hematoxylin and eosin–stained cross sections of colonic sections taken 8 wk after transfer of WT CD4+CD45RBhi T cells and WT (left) or WKO (right) CD4+CD45RBlo T cells to SCID recipient mice. (D) Clinical score of colitis 8 wk after transfer of WT or WKO CD4+CD45RBhi T cells and WT or WKO CD4+CD25+ nTreg cells. Each dot represents an individual mouse. Horizontal bars represent average. Shown are the combined data of three independent experiments. NS, Nonsignificant (P > 0.05). *, P < 0.05; **, P < 0.01.
Figure 3.
Figure 3.
Defective homing of WKO nTreg cells to peripheral lymphoid organs. (A) Reduced accumulation of WKO nTreg cells in the CD45RB transfer model. SCID mice were cotransferred with WT CD4+CD45RBhi and either WT (left) or WKO (right) nTreg cells. 10 wk after transfer, spleen, mesenteric lymph node, and colonic lamina propria cells were collected and stained for CD4 and Foxp3. Shown are representative dot plots of 6 and 10 mice per group. (B) nTreg cells or CD4+CD25 cells were isolated from peripheral lymphoid organs of WT and WKO mice, labeled with CFSE (WT) or TRITC (WKO), and mixed at a 1:1 ratio before intravenous injection to WT mice. Spleen and peripheral and mesenteric lymph nodes of recipient mice were harvested after 12–15 h, and the percentage of WKO lymphocyte homing relative to WT was determined. Shown are averages ± SD of combined data from two experiments including eight (CD4+CD25) and seven (nTreg cells) mice per group. Dashed line represents the input percentage.
Figure 4.
Figure 4.
WKO nTreg cells are defective in suppressing T cell proliferation in vitro. CD4+CD25 cells were isolated from the spleens of WT (A) and WKO (B) mice and were cocultured with mitomycin-treated T cell–depleted splenocytes and 0.5 μg/ml anti-CD3ɛ for 3 d in the presence of varying numbers of CD4+CD25+ regulatory T cells (nTreg cells) coming from the spleen of WT (black full line, dots) or WKO (gray dashed curve, squares) mice. Proliferation was measured by [3H]thymidine uptake (y axis). Ratios of CD25+/CD25 T cells are indicated on the x axis. Shown is one representative of five (left) and three (right) independent experiments performed in triplicate.
Figure 5.
Figure 5.
WT and WKO nTreg cells inefficiently remodel their actin cytoskeleton upon T cell receptor activation. (A–C) Reduced actin polarization of WT and WKO nTreg cells upon incubation with anti-CD3/anti-CD28–coated beads. Representative examples of cells with nonpolarized (A) and polarized actin (B) are displayed. Left panels represent phase images, and right panels show actin staining. Beads are marked with a cross. Bars, 5 μm. The percentage of CD4+CD25 or nTreg cells (black, WT; white, WKO) with polarized cytoskeleton relative to WT CD4+CD25 is shown in C. For each group, at least 300 conjugated cells have been examined. Shown are averages of three independent experiments ± SD. (D and E) Reduced T cell spreading by WT and WKO nTreg cells. An example of actin staining of WT CD4+CD25 splenocytes 10 min after incubation on anti-CD3/anti-CD28–coated coverslips is shown in D. Examples of spread T cells are indicated by arrowheads, and unspread T cells are represented by arrows. Bar, 5 μm. The percentage of CD4+CD25 or nTreg cells (isolated from WT [black] or WKO [white] mice) that were spread relative to WT CD4+CD25 is shown in E. For each group, at least 300 cells have been examined. Shown are averages of three independent experiments ± SD. NS, Nonsignificant (P > 0.05). *, P < 0.05; **, P < 0.01.
Figure 6.
Figure 6.
Exogenous IL-2 rescues WKO nTreg cell dysfunction. (A) WKO nTreg cells do not proliferate upon CD3-mediated stimulation and respond to exogenous IL-2. [3H]thymidine uptake of CD4+CD25+ nTreg cells isolated from the spleens of WT (black bars) or WKO (white bars) mice 3 d after stimulation with mitomycin-treated T cell–depleted splenocytes and 0.5 μg/ml anti-CD3ɛ or 0.5 μg/ml anti-CD3ɛ plus 10 μg/ml IL-2. Shown are averages ± SD of one representative of three independent experiments performed in triplicate. (B) IL-2 and antigen receptor–mediated preactivation of WKO nTreg cells substantially rescues their proliferation defects. [3H]thymidine uptake of CD4+CD25 T cells isolated from the spleens of WT mice and cocultured with CD4+CD25+ cells from WT (black curves) or WKO (gray curves) mice at different CD25+/CD25 ratios. Dashed curves represent suppressive effects of WT or WKO nTreg cells after a prior 3-d activation with 10 μg/ml of plate-bound anti-CD3ɛ and 25 μg/ml IL-2. Shown are results of one out of three independent experiments performed in triplicate. (C) Decreased IL-10 secretion of stimulated WKO nTreg cells. IL-10 concentrations were determined by ELISA in the supernatant of nTreg cells or CD4+CD25 splenocytes isolated from WT or WKO mice that were unstimulated or stimulated for 3 d with 10 μg/ml anti-CD3ɛ and 25 μg/ml IL-2, or PMA and ionomycin. Shown are averages of one representative of four independent experiments, each performed in duplicate. Error bars represent standard deviations.
Figure 7.
Figure 7.
Proposed model for nTreg cell dysfunction and colitis development in WKO mice. Decreased nTreg cell numbers in both the thymus and the periphery (lymph nodes) are observed in WKO mice and may result from IL-2 deficiency and TCR activation defects. IL-2 deficiency, aberrant nTreg cell homing, activation, and reduced IL-10 secretion lead to impaired suppression of colitogenic T cells and colitis.

References

    1. Dupuis-Girod, S., J. Medioni, E. Haddad, P. Quartier, M. Cavazzana-Calvo, F. Le Deist, G. de Saint Basile, J. Delaunay, K. Schwarz, J.L. Casanova, et al. 2003. Autoimmunity in Wiskott-Aldrich syndrome: risk factors, clinical features, and outcome in a single-center cohort of 55 patients. Pediatrics. 111:e622–e627. - PubMed
    1. Cannon, J.L., and J.K. Burkhardt. 2004. Differential roles for Wiskott-Aldrich syndrome protein in immune synapse formation and IL-2 production. J. Immunol. 173:1658–1662. - PubMed
    1. Badour, K., J. Zhang, F. Shi, M.K. McGavin, V. Rampersad, L.A. Hardy, D. Field, and K.A. Siminovitch. 2003. The Wiskott-Aldrich syndrome protein acts downstream of CD2 and the CD2AP and PSTPIP1 adaptors to promote formation of the immunological synapse. Immunity. 18:141–154. - PubMed
    1. Dupre, L., A. Aiuti, S. Trifari, S. Martino, P. Saracco, C. Bordignon, and M.G. Roncarolo. 2002. Wiskott-Aldrich syndrome protein regulates lipid raft dynamics during immunological synapse formation. Immunity. 17:157–166. - PubMed
    1. Sasahara, Y., R. Rachid, M.J. Byrne, M.A. de la Fuente, R.T. Abraham, N. Ramesh, and R.S. Geha. 2002. Mechanism of recruitment of WASP to the immunological synapse and of its activation following TCR ligation. Mol. Cell. 10:1269–1281. - PubMed

Publication types

MeSH terms

LinkOut - more resources