Comparative Study
. 2007 Feb 19;204(2):441-52.
doi: 10.1084/jem.20061737. Epub 2007 Feb 12.

Dyslipidemia inhibits Toll-like receptor-induced activation of CD8alpha-negative dendritic cells and protective Th1 type immunity

Affiliations
Comparative Study

Dyslipidemia inhibits Toll-like receptor-induced activation of CD8alpha-negative dendritic cells and protective Th1 type immunity

Abdijapar T Shamshiev et al. J Exp Med. .

Abstract

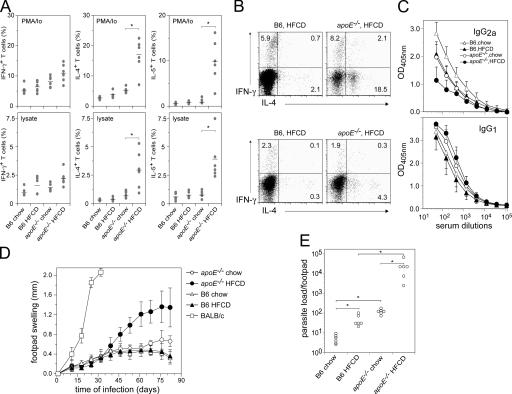
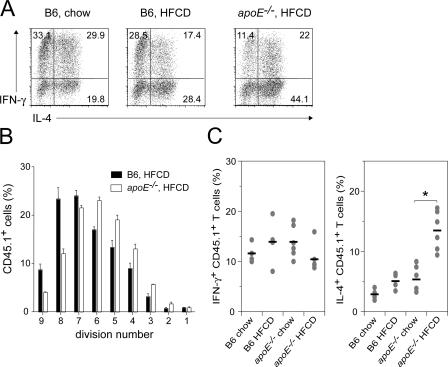
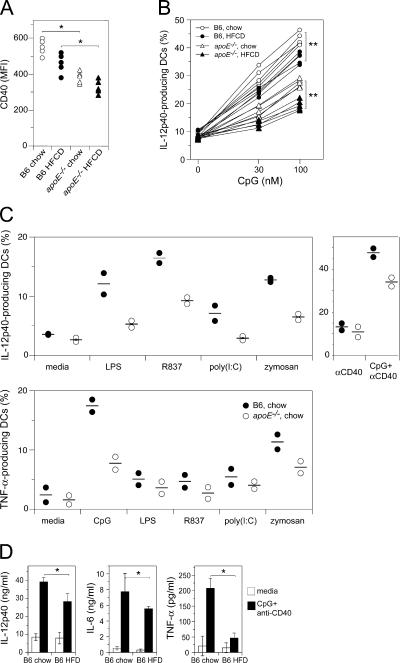
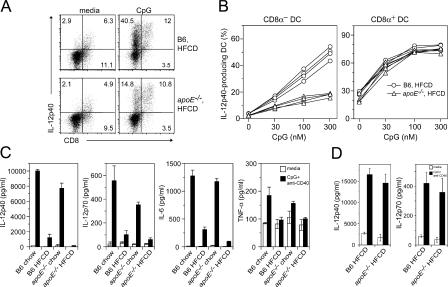
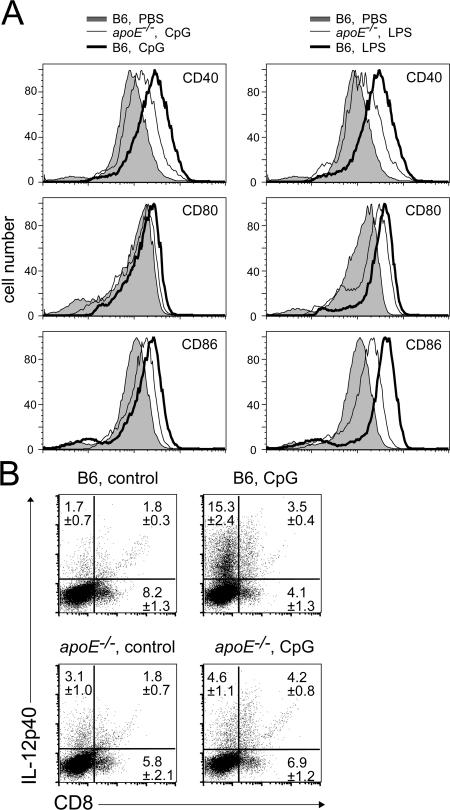
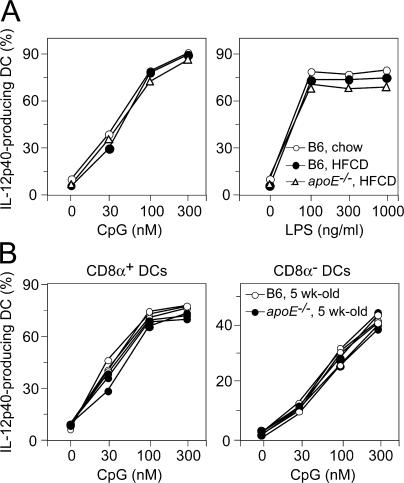
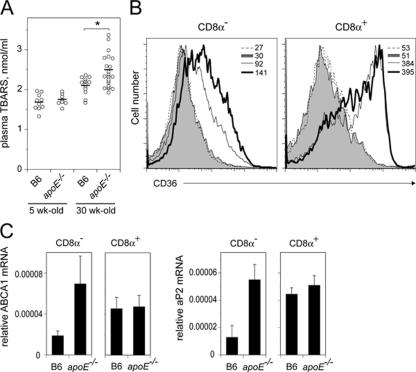
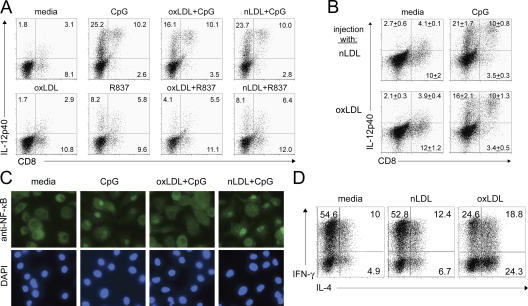
Environmental factors, including diet, play a central role in influencing the balance of normal immune homeostasis; however, many of the cellular mechanisms maintaining this balance remain to be elucidated. Using mouse models of genetic and high-fat/cholesterol diet-induced dyslipidemia, we examined the influence of dyslipidemia on T cell and dendritic cell (DC) responses in vivo and in vitro. We show that dyslipidemia inhibited Toll-like receptor (TLR)-induced production of proinflammatory cytokines, including interleukin (IL)-12, IL-6, and tumor necrosis factor-alpha, as well as up-regulation of costimulatory molecules by CD8alpha(-) DCs, but not by CD8alpha(+) DCs, in vivo. Decreased DC activation profoundly influenced T helper (Th) cell responses, leading to impaired Th1 and enhanced Th2 responses. As a consequence of this immune modulation, host resistance to Leishmania major was compromised. We found that oxidized low-density lipoprotein (oxLDL) was the key active component responsible for this effect, as it could directly uncouple TLR-mediated signaling on CD8alpha(-) myeloid DCs and inhibit NF-kappaB nuclear translocation. These results show that a dyslipidemic microenvironment can directly interfere with DC responses to pathogen-derived signals and skew the development of T cell-mediated immunity.


Figures

Figure 1.
Figure 1.
Increased susceptibility to infection with L. major in dyslipidemic mice. C57BL/6 (B6) and apoE / mice were maintained under a chow or HFCD for 8 wk and infected with L. major. (A) At 12 wk after infection, DLN cells were restimulated with PMA/ionomycin or L. major lysate, and expression of IFN-γ, IL-4, and -5 by CD4+ T cells was determined by flow cytometry. The values show the percentage of IFN-γ, IL-4, and -5 single-positive cells. Horizontal bars indicate mean values for each group. (B) Representative FACS plots of DLN cells from the indicated mice stimulated with either PMA/ionomycin (top) or L. major lysate (bottom) are shown. Gated on CD4+ T cells. (C) At 7 wk after infection, serum was collected and L. major–specific IgG2a and IgG1 antibodies were measured by ELISA. Error bars represent the mean ± the SD. (D) Footpad swelling in mice infected with L. major. Results are expressed as the mean lesion (millimeters) size ± the SD. (E) Parasite burden in infected mice at 12 wk post-infection. *, P < 0.05 compared with indicated controls. Data is representative of similar repeat experiments using 6–10 mice per group.
Figure 2.
Figure 2.
Dyslipidemia promotes Th2 cell development. (A) Splenic DCs were purified from chow diet– or HFCD-fed C57BL/6 (B6) and apoE / mice, followed by co-culture with naive GP61-80-specific CD4+ T cells in the presence of 10 nM GP61-80 peptide. On day 4, the proportion of IL-4– and IFN-γ–producing CD4+ T cells was determined by FACS. Numbers indicate the percentage of cells in each quadrant. (B and C) Naive GP61-80-specific CD4+ T cells (CD45.1+) were CFSE-labeled and transferred i.v. into the indicated mice 1 d before i.p. immunization with 40 μg GP61-80 peptide and 5 nmol CpG. (B) After 3 d, CFSE dilution of adoptively transferred cells was determined by FACS. The frequency of cells within each cycle was calculated after appropriate gating on the CFSE+ populations. (C) After 6 d, the production of IFN-γ and IL-4 by adoptively transferred cells was determined by FACS. Horizontal bars indicate mean values for each group (n = 5–6). Error bars represent the mean ± the SD.
Figure 3.
Figure 3.
Dyslipidemia inhibits TLR-mediated activation and inflammatory cytokine production of DC. Splenic DCs were isolated from either chow diet– or HFCD-fed C57BL/6 (B6) and apoE / mice. (A) CD40 surface expression on CD11c+ DCs after stimulation with 100 nM CpG. (B) Isolated cells were stimulated with the indicated doses of CpG for 6 h, followed by surface staining for CD11c and intracellular staining for IL-12p40. (C) Splenic DCs were isolated from chow diet–fed C57BL/6 or apoE / mice at 30 wk of age and stimulated with 100 nM CpG, 1 μg/ml LPS, 3 μg/ml R837, 5 μg/ml poly(I:C), 30 μg/ml zymosan, 5 μg/ml anti-CD40 antibodies, or a combination of anti-CD40 and CpG (100 nM) for 6 h, followed by surface staining for CD11c and intracellular staining for IL-12p40 and TNF-α. Horizontal bars indicate mean values for each group. (D) Splenic DCs were isolated from C57BL/6 mice fed either chow or HFD for 40 wk and stimulated with CpG/anti-CD40. Supernatants were collected after 20 h of culture and assayed for IL-12p40, IL-6, and TNF-α by ELISA. Data are shown as the mean of values from five mice for each group ± the SD. *, P < 0.05; **, P < 0.01, compared with indicated controls.
Figure 4.
Figure 4.
Impaired production of IL-12, -6, and TNF-α in dyslipidemic mice is restricted to the CD8α myeloid DC subset. Splenic DCs were isolated from HFCD-fed C57BL/6 (B6) or apoE / mice and stimulated with CpG for 6 h. (A) Representative dot plots from cells stimulated with 100 nM CpG are shown. (B) The proportion of IL-12p40–producing cells in CD8α and CD8α+ DC subsets after stimulation with the indicated doses of CpG. (C) Splenic CD8α DCs and (D) CD8α+ DCs were sorted by flow cytometry from C57BL/6 and apoE / mice were fed either a chow or HFCD for 10 wk and stimulated with CpG and anti-CD40. Supernatants were collected after 20 h of culture and assayed for IL-12p40, -12p35, -6, and TNF-α by ELISA. Error bars represent the mean ± the SD.
Figure 5.
Figure 5.
Impaired DC maturation and IL-12 production in dyslipidemic mice after LPS and CpG challenge in vivo. C57BL/6 (B6) and apoE / mice were fed HFCD for 12 wk, followed by i.v. injection of PBS, 10 nmol CpG, or 30 μg LPS. 5 h after administration, splenic DCs were purified and incubated ex vivo for an additional 12 h. (A) CD11c+CD8α DCs were analyzed for the expression of CD40, CD80, and CD86 by flow cytometry. The expression levels of CD40, CD80, and CD86 in PBS-injected B6 mice (shaded area) and apoE / mice (not depicted) were comparable. (B) HFCD-fed C57BL/6 or apoE / mice were injected i.v. with 10 nmol CpG. 5 h later, splenic DCs were purified and incubated in the presence of Brefeldin A, followed by staining for CD11c, CD8α, and IL-12p40. Numbers indicate the percentage of cells in each quadrant and represent the mean of values from three mice per group. Similar results were obtained with cells isolated from mice injected with LPS.
Figure 6.
Figure 6.
BMDCs generated from HFCD-fed apoE−/− mice and splenic DCs from 5-wk-old apoE−/− mice exhibit normal responses upon TLR stimulation. (A) C57BL/6 (B6) and apoE / mice were fed HFCD for 12 wk, and BM cells were pooled from two mice for each group, and BMDCs were generated in GM-CSF–containing media, as described in the Materials and methods. At day 9 of culture, DCs were stimulated with the indicated doses of CpG or LPS for 6 h, followed by surface and intracellular staining. The percentages of CD11c+ and IL-12p40+ cells for each BMDC culture are shown. Similar results were obtained with poly(I:C)-stimulated cells and intracellular staining for IL-6 and TNF-α. (B) Splenic DCs were purified from C57BL/6 (B6) and apoE / mice at 5 wk of age and stimulated with CpG for 6 h, followed by surface and intracellular staining. IL-12p40 production was analyzed in CD8α+ or CD8α CD11c+ DC subsets. The percentages of IL-12p40+ cells for each individual mouse are shown (n = 3).
Figure 7.
Figure 7.
Increased systemic lipid preoxidation and up-regulation of CD36 and oxLDL-induced genes in apoE−/− CD8α DCs. (A) 5- or 30-wk-old, chow diet–fed C57BL/6 mice and apoE / mice were fasted for 12 h. TBARS were determined in freshly collected plasma samples containing 5 mM EDTA, as described in Materials and methods. (B) CD36 expression was analyzed in splenic DCs isolated from chow diet–fed C57BL/6 (regular line) and apoE / (bold line) mice at 30 wk of age. Histograms are representative of data obtained from four mice in each group. Mean fluorescence intensity values are shown. Shaded and dashed lines show staining of C57BL/6 and apoE / DCs with an isotype-matched control antibody, respectively. (C) CD8α and CD8α+ DCs were sorted from the spleens of chow diet–fed C57BL/6 and apoE / mice at 30 wk of age. ABCA1 and aP2 mRNA levels were quantified by quantitative real time PCR. Horizontal bars indicate mean values for each group (n = 8–22). *, P <0.01, compared with corresponding controls. Error bars represent the mean ± the SD.
Figure 8.
Figure 8.
oxLDL inhibits CpG-induced IL-12p40 production and NF-κB nuclear translocation in CD8α DCs, and promotes Th2 cell differentiation. (A) C57BL/6 splenic DCs were incubated with 40 μg/ml nLDL or 40 μg/ml oxLDL for 1 h at 37°C. After washing, DCs were activated with 100 nM CpG or 5 μg/ml R837 for 6 h, followed by surface staining for CD11c and CD8α, and intracellular staining for IL-12p40. Gated on CD11c+ cells. The numbers indicate the percentage of cells in each quadrant. (B) C57BL/6 mice (n = 3) were injected i.v. with 2 mg/dose of either nLDL or oxLDL. After 3 h, splenic DCs were ex vivo stimulated with CpG and stained as described for A. (C) BMDCs were cultured on coverslips and incubated with 60 μg/ml nLDL or 60 μg/ml oxLDL for 1 h, and then stimulated with 300 nM CpG for 30 min at 37°C. Cells were permeabilized and immunostained with anti–NF-κB p65 and Alexa Fluor goat anti–rabbit IgG (green, top); nuclei were stained with DAPI (blue, bottom). (D) C57BL/6 splenic DCs were exposed to10 μg/ml nLDL or 10 μg/ml oxLDL for 1 h and co-cultured with naive GP61-80-specific CD4+ T cells in the presence of 100 nM GP61-80 peptide. At day 4, T cells were restimulated with PMA/ionomycin and stained for intracellular IL-4 and IFN-γ. Gated on CD4+ T cells. The numbers indicate the percentage of cells in each quadrant.

Similar articles

Cited by

References

    1. Kapsenberg, M.L. 2003. Dendritic-cell control of pathogen-driven T-cell polarization. Nat. Rev. Immunol. 3:984–993. - PubMed
    1. Sallusto, F., M. Cella, C. Danieli, and A. Lanzavecchia. 1995. Dendritic cells use macropinocytosis and the mannose receptor to concentrate macromolecules in the major histocompatibility complex class II compartment: downregulation by cytokines and bacterial products. J. Exp. Med. 182:389–400. - PMC - PubMed
    1. Sporri, R., and C. Reis e Sousa. 2005. Inflammatory mediators are insufficient for full dendritic cell activation and promote expansion of CD4+ T cell populations lacking helper function. Nat. Immunol. 6:163–170. - PubMed
    1. Hsieh, C.S., S.E. Macatonia, C.S. Tripp, S.F. Wolf, A. O'Garra, and K.M. Murphy. 1993. Development of TH1 CD4+ T cells through IL-12 produced by Listeria-induced macrophages. Science. 260:547–549. - PubMed
    1. Mattner, F., J. Magram, J. Ferrante, P. Launois, K. Di Padova, R. Behin, M.K. Gately, J.A. Louis, and G. Alber. 1996. Genetically resistant mice lacking interleukin-12 are susceptible to infection with Leishmania major and mount a polarized Th2 cell response. Eur. J. Immunol. 26:1553–1559. - PubMed

Publication types

MeSH terms