

Expression of the transcription factor cKrox in peripheral CD8 T cells reveals substantial postthymic plasticity in CD4-CD8 lineage differentiation
- PMID: 17296789
- PMCID: PMC2118724
- DOI: 10.1084/jem.20061982
Expression of the transcription factor cKrox in peripheral CD8 T cells reveals substantial postthymic plasticity in CD4-CD8 lineage differentiation
Abstract
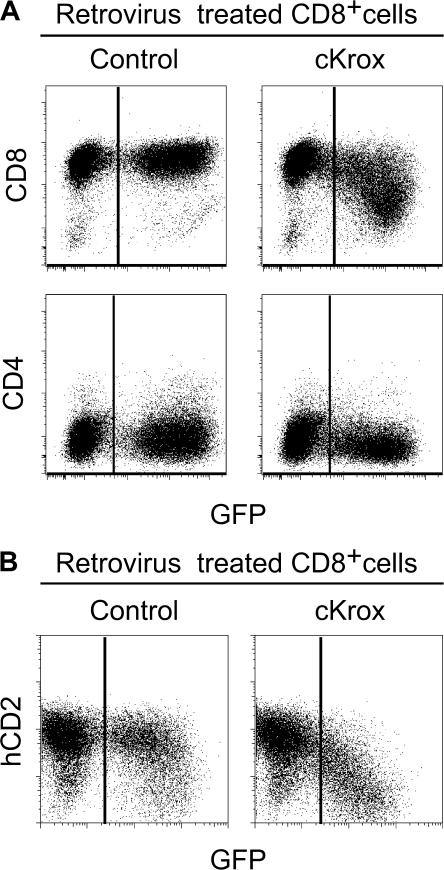
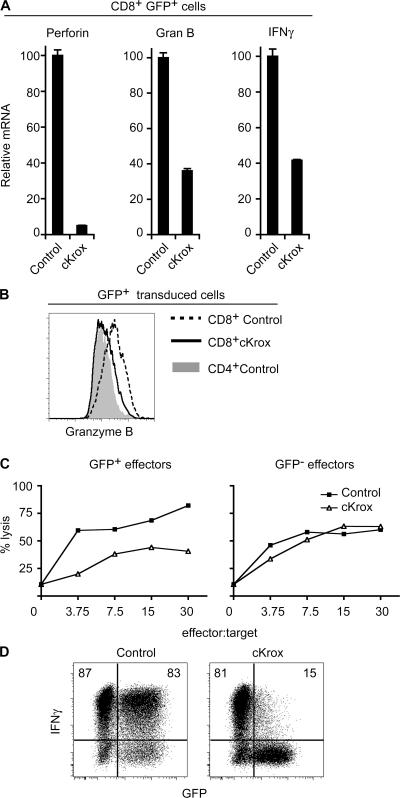
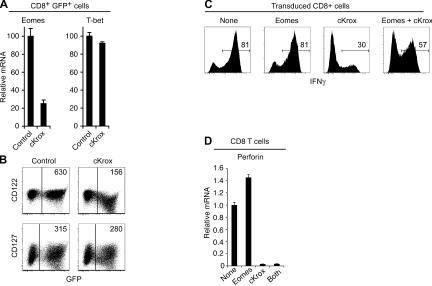
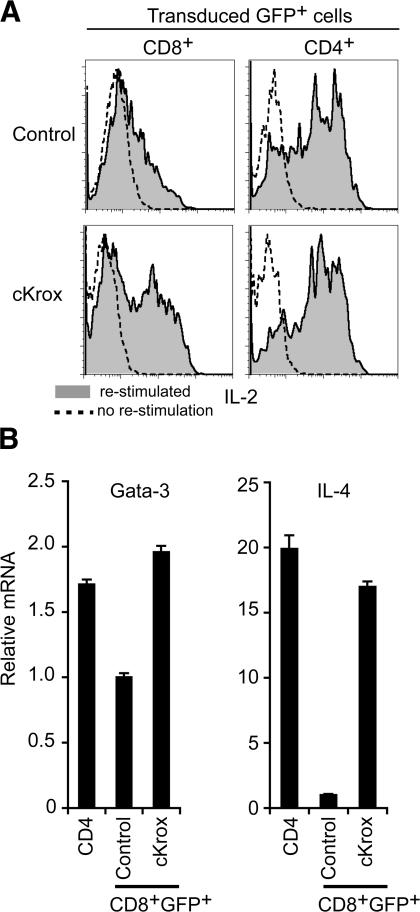
Most T cells belong to either of two lineages defined by the mutually exclusive expression of CD4 and CD8 coreceptors: CD4 T cells are major histocompatibility complex (MHC) II restricted and have helper function, whereas CD8 T cells are MHC I restricted and have cytotoxic function. The divergence between these two lineages occurs during intrathymic selection and is thought to be irreversible in mature T cells. It is, however, unclear whether the CD4-CD8 differentiation of postthymic T cells retains some level of plasticity or is stably maintained by mechanisms distinct from those that set lineage choice in the thymus. To address this issue, we examined if coreceptor or effector gene expression in mature CD8 T cells remains sensitive to the zinc finger transcription factor cKrox, which promotes CD4 and inhibits CD8 differentiation when expressed in thymocytes. We show that cKrox transduction into CD8 T cells inhibits their expression of CD8 and cytotoxic effector genes and impairs their cytotoxic activity, and that it promotes expression of helper-specific genes, although not of CD4 itself. These observations reveal a persistent degree of plasticity in CD4-CD8 differentiation in mature T cells.
Figures
Similar articles
-
CD4-CD8 lineage differentiation: Thpok-ing into the nucleus.J Immunol. 2009 Sep 1;183(5):2903-10. doi: 10.4049/jimmunol.0901041. J Immunol. 2009. PMID: 19696430 Free PMC article. Review.
-
The zinc finger protein cKrox directs CD4 lineage differentiation during intrathymic T cell positive selection.Nat Immunol. 2005 Apr;6(4):373-81. doi: 10.1038/ni1183. Epub 2005 Mar 6. Nat Immunol. 2005. PMID: 15750595
-
Analyzing expression of perforin, Runx3, and Thpok genes during positive selection reveals activation of CD8-differentiation programs by MHC II-signaled thymocytes.J Immunol. 2005 Oct 1;175(7):4465-74. doi: 10.4049/jimmunol.175.7.4465. J Immunol. 2005. PMID: 16177089
-
The order and logic of CD4 versus CD8 lineage choice and differentiation in mouse thymus.Nat Commun. 2021 Jan 4;12(1):99. doi: 10.1038/s41467-020-20306-w. Nat Commun. 2021. PMID: 33397934 Free PMC article.
-
The regulation of CD4 and CD8 coreceptor gene expression during T cell development.Annu Rev Immunol. 1999;17:523-54. doi: 10.1146/annurev.immunol.17.1.523. Annu Rev Immunol. 1999. PMID: 10358767 Review.
Cited by
-
Th inducing POZ-Kruppel Factor (ThPOK) is a key regulator of the immune response since the early steps of colorectal carcinogenesis.PLoS One. 2013;8(1):e54488. doi: 10.1371/journal.pone.0054488. Epub 2013 Jan 17. PLoS One. 2013. PMID: 23349906 Free PMC article.
-
Expanding roles for ThPOK in thymic development.Immunol Rev. 2010 Nov;238(1):182-94. doi: 10.1111/j.1600-065X.2010.00958.x. Immunol Rev. 2010. PMID: 20969593 Free PMC article. Review.
-
The ThPOK transcription factor differentially affects the development and function of self-specific CD8(+) T cells and regulatory CD4(+) T cells.Immunology. 2014 Mar;141(3):431-45. doi: 10.1111/imm.12205. Immunology. 2014. PMID: 24708418 Free PMC article.
-
CD4-CD8 lineage differentiation: Thpok-ing into the nucleus.J Immunol. 2009 Sep 1;183(5):2903-10. doi: 10.4049/jimmunol.0901041. J Immunol. 2009. PMID: 19696430 Free PMC article. Review.
-
The zinc finger transcription factor Zbtb7b represses CD8-lineage gene expression in peripheral CD4+ T cells.Immunity. 2008 Dec 19;29(6):876-87. doi: 10.1016/j.immuni.2008.09.019. Epub 2008 Dec 8. Immunity. 2008. PMID: 19062319 Free PMC article.
References
-
- Wilson, C.B., K.W. Makar, M. Shnyreva, and D.R. Fitzpatrick. 2005. DNA methylation and the expanding epigenetics of T cell lineage commitment. Semin. Immunol. 17:105–119. - PubMed
-
- Taniuchi, I., W. Ellmeier, and D.R. Littman. 2004. The CD4/CD8 lineage choice: new insights into epigenetic regulation during T cell development. Adv. Immunol. 83:55–89. - PubMed
-
- Zou, Y.R., M.J. Sunshine, I. Taniuchi, F. Hatam, N. Killeen, and D.R. Littman. 2001. Epigenetic silencing of CD4 in T cells committed to the cytotoxic lineage. Nat. Genet. 29:332–336. - PubMed
-
- Grueter, B., M. Petter, T. Egawa, K. Laule-Kilian, C.J. Aldrian, A. Wuerch, Y. Ludwig, H. Fukuyama, H. Wardemann, R. Waldschuetz, et al. 2005. Runx3 regulates integrin{alpha}E/CD103 and CD4 expression during development of CD4−/CD8+ T cells. J. Immunol. 175:1694–1705. - PubMed
-
- Telfer, J.C., E.E. Hedblom, M.K. Anderson, M.N. Laurent, and E.V. Rothenberg. 2004. Localization of the domains in runx transcription factors required for the repression of CD4 in thymocytes. J. Immunol. 172:4359–4370. - PubMed
Publication types
MeSH terms
Substances
Grants and funding
LinkOut - more resources
Full Text Sources
Other Literature Sources
Molecular Biology Databases
Research Materials
