. 2007 Feb 12;176(4):445-58.
doi: 10.1083/jcb.200609014.

DSL ligand endocytosis physically dissociates Notch1 heterodimers before activating proteolysis can occur

Affiliations

DSL ligand endocytosis physically dissociates Notch1 heterodimers before activating proteolysis can occur

James T Nichols et al. J Cell Biol. .

Abstract

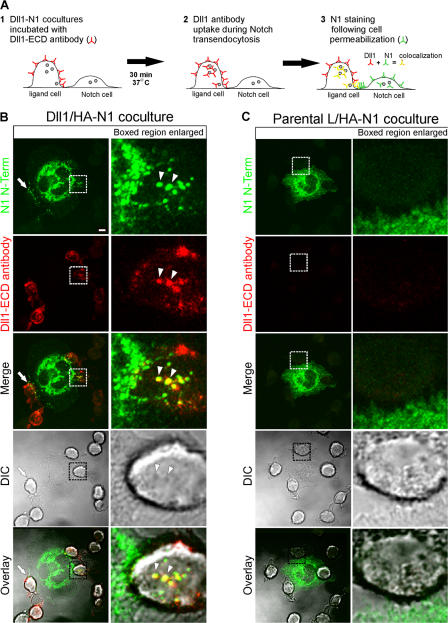
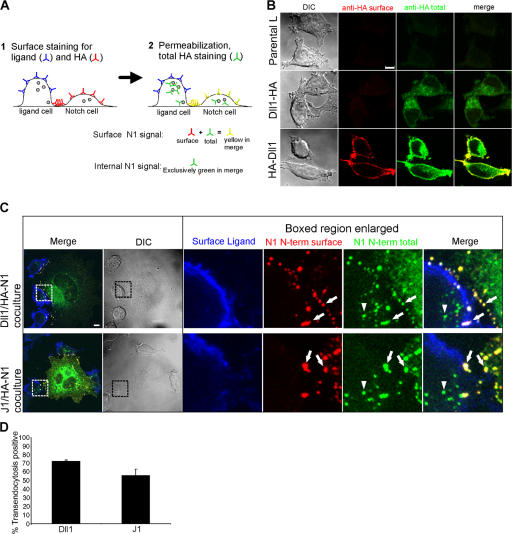
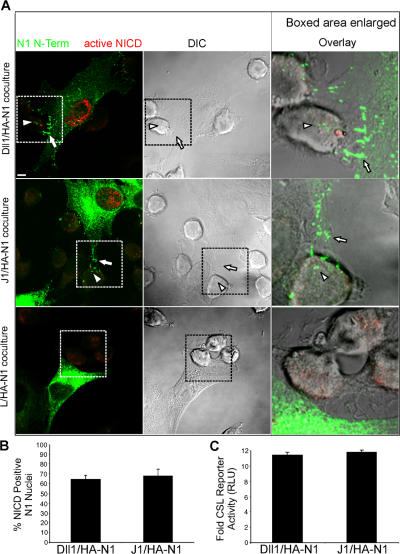
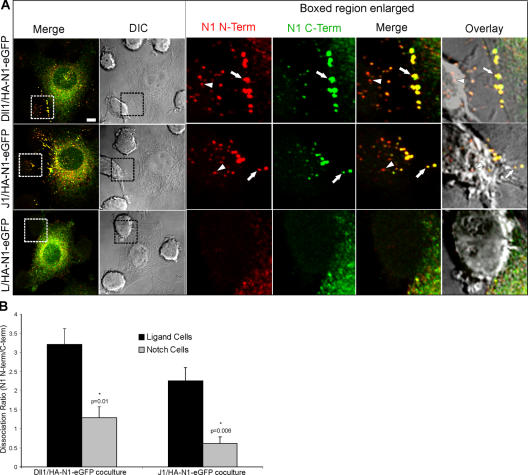
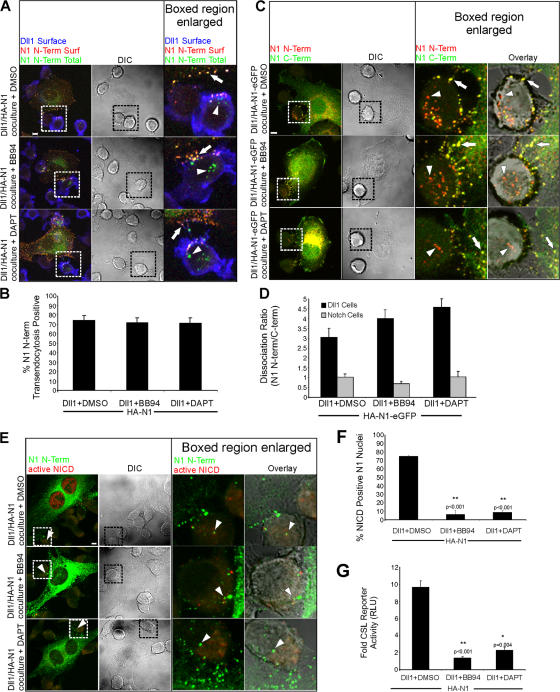
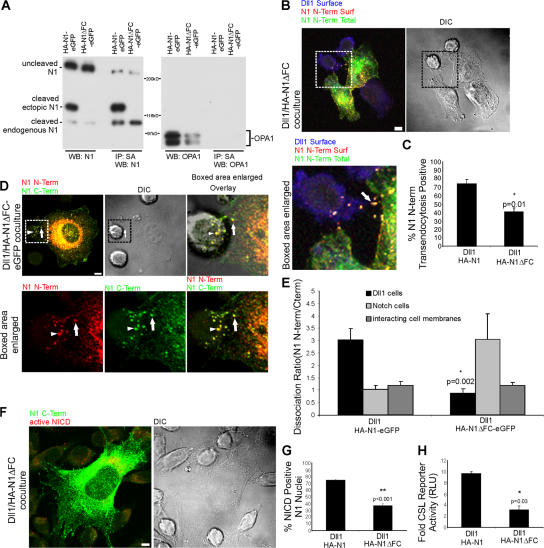
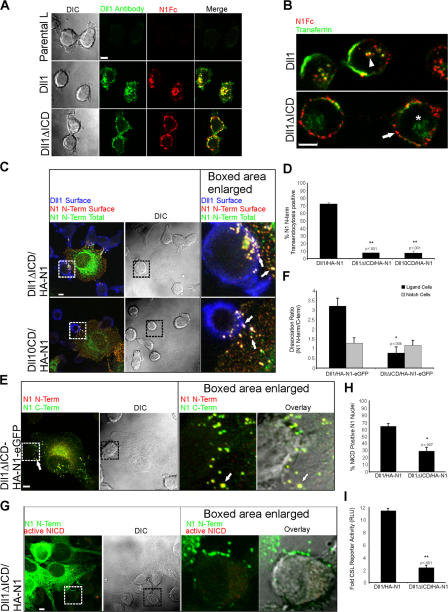
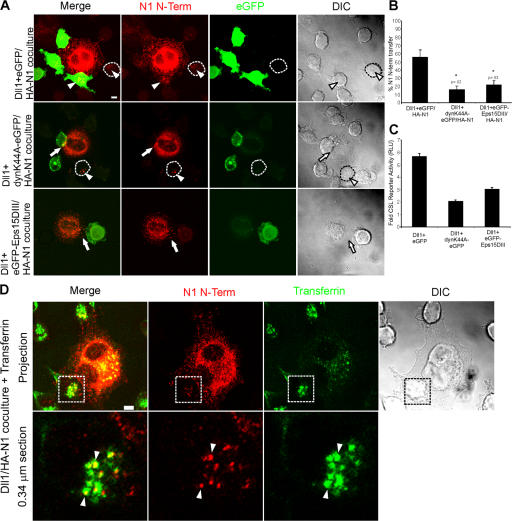
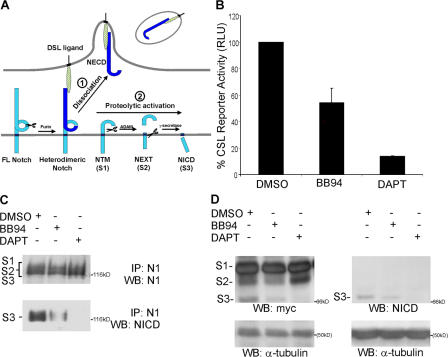
Cleavage of Notch by furin is required to generate a mature, cell surface heterodimeric receptor that can be proteolytically activated to release its intracellular domain, which functions in signal transduction. Current models propose that ligand binding to heterodimeric Notch (hNotch) induces a disintegrin and metalloprotease (ADAM) proteolytic release of the Notch extracellular domain (NECD), which is subsequently shed and/or endocytosed by DSL ligand cells. We provide evidence for NECD release and internalization by DSL ligand cells, which, surprisingly, did not require ADAM activity. However, losses in either hNotch formation or ligand endocytosis significantly decreased NECD transfer to DSL ligand cells, as well as signaling in Notch cells. Because endocytosis-defective ligands bind hNotch, but do not dissociate it, additional forces beyond those produced through ligand binding must function to disrupt the intramolecular interactions that keep hNotch intact and inactive. Based on our findings, we propose that mechanical forces generated during DSL ligand endocytosis function to physically dissociate hNotch, and that dissociation is a necessary step in Notch activation.


Figures

Figure 1.
Figure 1.
DSL ligands induce clustering and transendocytosis of Notch1. (A) Coculture and staining protocol for Dll1 endocytosis and N1 transendocytosis (see Materials and methods for details). Small filled circles represent intracellular vesicles. (B and C) HA-N1 C2C12 cells were cocultured with Dll1 (B) or parental L (C) cells in the presence of rabbit anti-Dll1 extracellular domain (ECD) antibodies to track Dll1 internalization. Cells were then fixed, permeabilized, stained with an HA antibody (16B12) conjugated to Alexa Fluor 488 to detect N1 N terminus (green) and anti–rabbit Alexa Fluor 633 to detect Dll1 antibodies (red), and imaged by confocal and differential interference contrast (DIC) microscopy. Arrows indicate N1 puncta polarized at interfaces of Dll1–N1 cells; arrowheads indicate colocalization of N1 and Dll1 within the Dll1 cell (yellow). Boxes indicate enlarged regions. Overlays are composites of fluorescent and DIC images. Images were uniformly adjusted using the levels function in Photoshop (Adobe). Bar, 5 μm.
Figure 2.
Figure 2.
Transendocytosed Notch1 structures are internal and disconnected from the plasma membrane. (A) Staining protocol to distinguish surface and internal N1 (see Materials and methods for details). (B) Validation of protocol in A. L cells expressing Dll1 with HA tags on either the intracellular (Dll1-HA) or extracellular (HA-Dll1) domain were fixed and stained for surface HA with mouse HA antibody (262K) and anti–mouse Alexa Fluor 568 (red). After permeabilization, cells were stained for total HA (surface and intracellular) with an HA antibody (16B12) conjugated to Alexa Fluor 488 (green) and imaged by confocal and DIC microscopy. (C) Cocultures of HA-N1 cells with Dll1 or J1 cells were fixed and stained with rabbit anti-ECD antibodies to Dll1 or J1 and anti–rabbit Alexa Fluor 633 antibodies (blue) to label the surface of the ligand cell, followed by staining for surface N1 N terminus with a mouse HA antibody (262K) and anti–mouse Alexa Fluor 568 (red). After permeabilization, cells were stained for total N1 N terminus (surface and intracellular) with an HA antibody (16B12) conjugated to Alexa Fluor 488 (green), and imaged by confocal and DIC microscopy. Arrows indicate N1 N terminus on both the Notch cell surface (yellow) and the ligand cell surface (white). Arrowheads indicate internal N1 N terminus detected within ligand cells (green). Boxes denote enlarged regions. (D) Transendocytosis was quantified by examining Dll1 or J1 cells for N1 N terminus detected exclusively after permeabilization (see Materials and methods). Error bars represent the SEM. Images from each experiment were uniformly adjusted using the levels function in Photoshop. Bars, 5 μm.
Figure 3.
Figure 3.
DSL ligands mediate clustering and transendocytosis of Notch1 to activate Notch1 proteolysis and downstream signaling. (A) HA-N1 cells cocultured with Dll1, J1, or parental L cells were fixed, permeabilized, and stained with an HA antibody (16B12) conjugated to Alexa Fluor 488 to detect the N1 N terminus (green), followed by rabbit antibodies to activated NICD (Val1744) and anti–rabbit Alexa Fluor 568 (red) and imaged by confocal and DIC microscopy. Arrows indicate N1 N terminus polarized to sites of contact between ligand and N1 cells. Arrowheads indicate N1 N terminus within ligand cells interacting with N1 cells and displaying a signal for activated NICD in the nucleus. Boxes denote enlarged regions; overlays are composites of fluorescent and DIC images. A low level of red-channel nonnuclear background fluorescence that is insensitive to DAPT (Fig. 5 E) is detected with all L-cell lines. (B) Cells displaying transfer of N-terminal puncta to Dll1 or J1 cells were scored for NICD-positive nuclei. (C) HA-N1 cells transfected with a CSL-luciferase reporter were cocultured with ligand cells and assayed for luciferase activity. Values represent fold-induction over cocultures with parental L cells. RLU, relative luciferase units. Error bars represent the SEM (B) and the SD (C). Images were uniformly adjusted using the levels function in Photoshop. Bar, 5 μm.
Figure 4.
Figure 4.
DSL ligand–induced transendocytosis promotes separation of the Notch1 N- and C-terminal subunits. (A) HA-N1-EGFP C2C12 cells were cocultured with Dll1, J1, or parental L cells. Cocultures were fixed, permeabilized, and stained with a mouse HA antibody (262K) and anti–mouse Alexa Fluor 568 to detect the N1 N terminus (red) and a rabbit anti-GFP antibody conjugated to Alexa Fluor 488 to detect the N1 C terminus (green), and then imaged by confocal and DIC microscopy. Arrows indicate double-positive HA-N1-EGFP clusters at interfaces between N1 and ligand cells. Arrowheads indicate puncta positive only for the N1 N terminus within ligand cells. Boxes denote enlarged regions; overlays are composites of fluorescent and DIC images. (B) The signals for Notch N and C termini were divided to produce the dissociation ratio (see Materials and methods) for ligand and Notch cells. Error bars represent the SEM. *, P < 0.05; t test relative to ligand cells. Images were uniformly adjusted using the levels function in Photoshop. Bar, 5 μm.
Figure 5.
Figure 5.
Notch1 transendocytosis and N-terminal dissociation does not require cleavage by ADAM or γ-secretase. (A) Dll1 cells were cocultured with HA-N1 cells in the presence of vehicle control (DMSO), ADAM inhibitor (BB94), or γ-secretase inhibitor (DAPT). Cocultures were treated as in Fig. 2 (A and C) to identify surface Dll1 (blue), surface N1 N terminus (red), and total N1 N terminus (green). Arrows indicate N1 N terminus on the surface of the Notch cells (yellow). Arrowheads indicate N1 N terminus detected within Dll1 cells (green). (B) Transendocytosis was quantified as in Fig. 2 D. (C) Dll1 cells were cocultured with HA-N1-EGFP cells in the presence of DMSO, BB94, or DAPT, as in Fig. 4 A, to identify N1 N terminus (red) and N1 C terminus (green). Arrows indicate double-positive N1 clusters (yellow); arrowheads denote vesicular structures positive for only N1 N terminus (red). (D) Dissociation ratios were quantified for both Dll1 and Notch cells, as in Fig. 4 B. (E) Dll1 cells were cocultured with HA-N1 cells in the presence of DMSO, BB94, or DAPT, as in Fig. 3 A, to identify N1 N terminus (green) and activated NICD (red). Arrowheads indicate N1 N terminus within Dll1 cells interacting with N1 cells. (F) NICD-positive nuclei were scored as in Fig. 3 B. (G) CSL reporter assay in the presence of DMSO, BB94, or DAPT as in Fig. 3 C. Cocultures in (A, C, and E) were imaged by confocal and DIC microscopy. Boxes indicate enlarged regions. Overlays are composites of fluorescent and DIC images. Error bars represent the SEM (B, D, and F) and the SD (G). *, P < 0.05; **, P < 0.001; t test relative to DMSO controls. Images from each experiment were uniformly adjusted using the levels function in Photoshop. Bars, 5 μm.
Figure 6.
Figure 6.
Notch1 transendocytosis, N-terminal dissociation, and signaling require furin processing. (A) C2C12 cells stably expressing HA-N1-EGFP or the furin cleavage mutant HA-N1ΔFC-EGFP were biotinylated, and lysates were quantitated and equilibrated. Whole cell lysates, as well as streptavidin precipitates, were analyzed by Western blotting with antibodies to N1 intracellular domain (93–4), or OPA1. Uncleaved N1, as well as the C-terminal, 120-kD, furin-processed subunit of both ectopic and endogenous N1, are detected. (B) Dll1 cells were cocultured with HA-N1ΔFC cells, as in Fig. 2 C, to identify surface Dll1 (blue), surface N1 N terminus (red), and total N1 N terminus (green). Arrow indicates N1 N terminus at the interface of Notch and Dll1 cells. (C) Transendocytosis was quantified as in Fig. 2 D. (D) Dll1 cells were cocultured with HA-N1ΔFC-EGFP as in Fig. 4 A to identify N1 N terminus (red) and N1 C terminus (green). Arrows indicate double-positive N1 clusters at the interface of Notch and Dll1 cells; arrowheads denote double-positive structures associated with Dll1 cells. (E) Dissociation ratio was quantified for Dll1 cells, Notch cells, and the interacting cell membranes as in Fig. 4 B. (F) Dll1 cells were cocultured with HA-N1ΔFC cells and treated as in Fig. 3 A to identify N1 N terminus (green) and activated NICD (red). (G) NICD-positive nuclei were scored as in Fig. 3 B. (H) CSL reporter assay with HA-N1 or HA-N1ΔFC cells, as in Fig. 3 C. Cocultures in B, D, and F were imaged by confocal and DIC microscopy. Boxes indicate enlarged regions. Overlays are composites of fluorescent and DIC images. Error bars represent the SEM (C, E, and G) and the SD (H). *, P < 0.05, **, P < 0.001; t test relative to wild-type N1. Images from each experiment were uniformly adjusted using the levels function in Photoshop. Bars, 5 μm.
Figure 7.
Figure 7.
Notch1 transendocytosis, hNotch1 subunit separation, and signaling require Dll1 endocytosis. (A) Dll1, Dll1ΔICD, or parental L cells were incubated with rabbit Dll1 extracellular domain (ECD) antibodies and N1Fc to track Dll1. After incubation, the cells were fixed, permeabilized, and stained with anti–rabbit Alexa Fluor 488 to detect Dll1 antibodies (green) and anti–human Fc conjugated to Cy5 (red) to detect N1Fc. (B) Dll1 or Dll1ΔICD cells were incubated with N1Fc preclustered with anti–human Fc conjugated to Texas red (red), and transferrin conjugated to FITC (green). Arrowhead indicates internalized N1Fc colocalized with transferrin in Dll1 cells (yellow). Arrow indicates N1Fc on the surface of Dll1ΔICD cells (red). Asterisk indicates internalized transferrin. (C) Cocultures of HA-N1 cells and Dll1ΔICD or Dll10CD cells were treated as in Fig. 2 C to identify surface mutant Dll1 (blue), surface N1 N terminus (red), and total N1 N terminus (green). Arrows indicate N1 N terminus on the surface of the Notch cell (yellow), as well as the mutant ligand cell (white). (D) Transendocytosis was quantified as in Fig. 2 D. (E) Cocultures of HA-N1-EGFP and Dll1ΔICD cells were treated as in Fig. 4 A to identify N1 N terminus (red) and N1 C terminus (green). Arrow indicates double-positive HA-N1-EGFP cluster (yellow). (F) Dissociation ratio was quantified as in Fig. 4 B. (G) Dll1ΔICD cells were cocultured with HA-N1 cells and treated as in Fig. 3 A to identify N1 N terminus (green) and activated NICD (red). (H) NICD-positive nuclei were scored as in Fig. 3 B. (I) CSL reporter assay, as in Fig. 3 C. Cells in A–C, E, and G were imaged by confocal and DIC microscopy. Boxes indicate enlarged regions. Overlays are composites of fluorescent and DIC images. *, P < 0.05; **, P < 0.001; t test relative to Dll1 cells. Error bars represent the SEM (D, F, and H) and the SD (I). Images from each experiment were uniformly adjusted using the levels function in Photoshop. Bars, 5 μm.
Figure 8.
Figure 8.
Notch1 transendocytosis and signaling require general endocytic machinery. (A) Dll1 cells were transiently transfected with EGFP, dynaminK44A-EGFP, or EGFP-Eps15DIII, and then cocultured with HA-N1 cells. Cocultures were fixed, permeabilized, and stained with a mouse HA antibody (262K) and anti–mouse conjugated to Alexa Fluor 568 to detect the N1 N terminus (red), followed by rabbit anti-GFP conjugated to Alexa Fluor 488 to detect EGFP (green). Arrows indicate interacting N1 N terminus. Arrowheads indicate N1 N terminus associated with Dll1 cells. An untransfected Dll1 cell is outlined. Fluorescent images are confocal projections through the midsection of the Dll1 cell. (B) Transfer of N1 N terminus was quantified by examining Dll1 cells displaying EGFP fluorescence for internal N1 N terminus (see Materials and methods). (C) HA-N1 cells transfected with a CSL-luciferase reporter were cocultured with HEK 293-T cells cotransfected with Dll1 and EGFP, dynaminK44A-EGFP, or EGFP-Eps15DIII and assayed for luciferase activity. Values are fold-induction over vector + EGFP-transfected cells. (D) HA-N1 cells were cocultured with Dll1 cells in the presence of transferrin conjugated to FITC (green). Cocultures were fixed, permeabilized, and stained with a mouse HA antibody (262K) and anti–mouse conjugated to Alexa Fluor 568 to detect the N1 N terminus (red). Arrowheads indicate colocalization of transferrin and N1 N terminus in Dll1 cells (yellow). Boxes denote enlarged region. Low magnification fluorescent images are confocal projections, and enlargements are a 0.34 μm confocal section through the midsection of the Dll1 cell. Error bars represent the SEM (B) and the SD (C). *, P < 0.05; t test relative to Dll1+EGFP cells. Images from each experiment were uniformly adjusted using the levels function in Photoshop. Bars, 5 μm.
Figure 9.
Figure 9.
A two-step model for Notch activation: DSL ligand endocytosis dissociates Notch heterodimers and permits activating proteolysis. (A) After ligand binding to Notch, DSL ligand-mediated endocytosis nonenzymatically dissociates the Notch heterodimeric subunits (1). Physical removal of NECD by transendocytosis exposes the remaining membrane-bound NTM subunit to ADAM and γ-secretase proteolysis for release of NICD (2). (B) COS7 cells were transfected with either a truncated NTM-like construct (p120mis) or vector control and a CSL-luciferase reporter construct, and then incubated in the presence of DMSO, BB94, or DAPT. Luciferase activity is shown as a percentage of the DMSO control activity of p120mis. The average p120mis activity was 23-fold over the vector control. (C) COS7 cells were transiently transfected with an NTM-like construct (p120mis) and cultured in the presence of DMSO, BB94, or DAPT, as well as a proteosome inhibitor (MG132). Cell lysates were immunoprecipitated with rabbit antibodies to N1 intracellular domain (PCR12), followed by Western blot analysis with antibodies to N1 intracellular domain (93–4; top) or rabbit antibodies to activated NICD (Val 1744; bottom). (D) A truncated NTM-like construct, p120misΔmyc, was transiently transfected into COS7 cells and cultured in the presence of DMSO, BB94, or DAPT, as well as a proteosome inhibitor (MG132). Cell lysates were analyzed by Western blotting with myc (9E10) or NICD (Val1744) antibodies, and detection of α-tubulin was used as a loading control.

Similar articles

Cited by

References

    1. Benmerah, A., C. Lamaze, B. Begue, S.L. Schmid, A. Dautry-Varsat, and N. Cerf-Bensussan. 1998. AP-2/Eps15 interaction is required for receptor-mediated endocytosis. J. Cell Biol. 140:1055–1062. - PMC - PubMed
    1. Blaumueller, C.M., H. Qi, P. Zagouras, and S. Artavanis-Tsakonas. 1997. Intracellular cleavage of Notch leads to a heterodimeric receptor on the plasma membrane. Cell. 90:281–291. - PubMed
    1. Brou, C., F. Logeat, N. Gupta, C. Bessia, O. LeBail Jr., A. Doedens, P. Cumano, B.R.A. Roux, and A. Israel. 2000. A novel proteolytic cleavage involved in Notch signaling: the role of the Disintegrin-Metalloprotease TACE. Mol. Cell. 5:207–216. - PubMed
    1. Brown, M.S., J. Ye, R.B. Rawson, and J.L. Goldstein. 2000. Regulated intramembrane proteolysis: a control mechanism conserved from bacteria to humans. Cell. 100:391–398. - PubMed
    1. Bush, G., G. diSibio, A. Miyamoto, J.B. Denault, R. Leduc, and G. Weinmaster. 2001. Ligand-induced signaling in the absence of furin processing of Notch1. Dev. Biol. 229:494–502. - PubMed

Publication types