. 2007 Feb 12;176(4):521-33.
doi: 10.1083/jcb.200604167.

Organization of beta-adrenoceptor signaling compartments by sympathetic innervation of cardiac myocytes

Affiliations

Organization of beta-adrenoceptor signaling compartments by sympathetic innervation of cardiac myocytes

Olga G Shcherbakova et al. J Cell Biol. .

Abstract

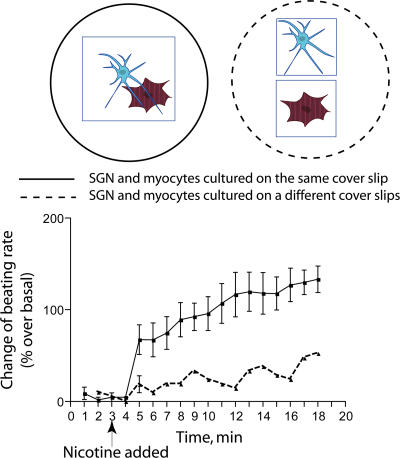
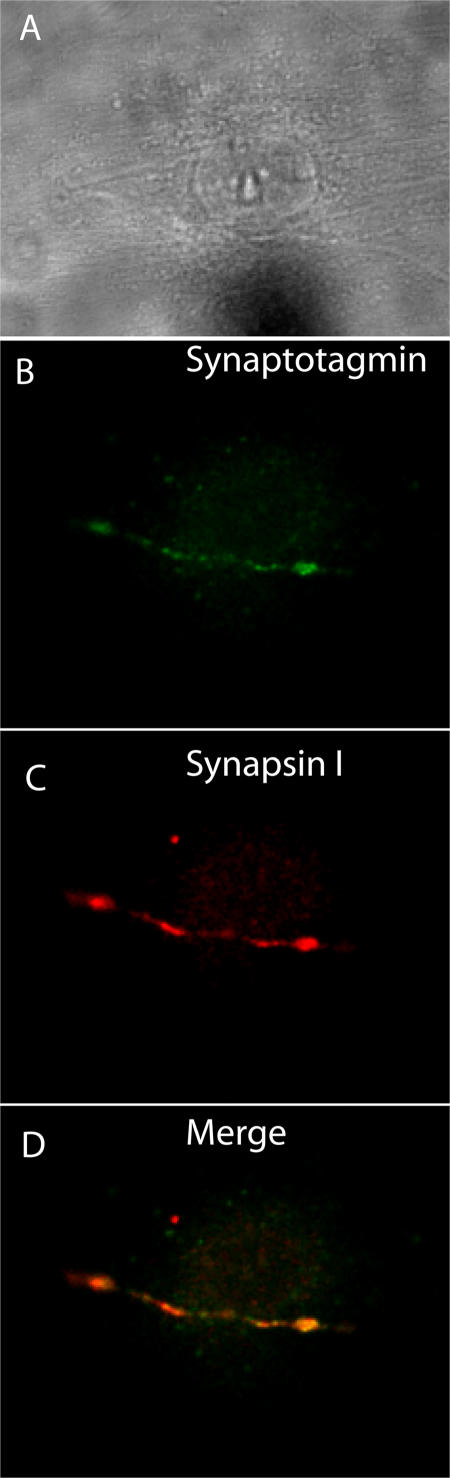
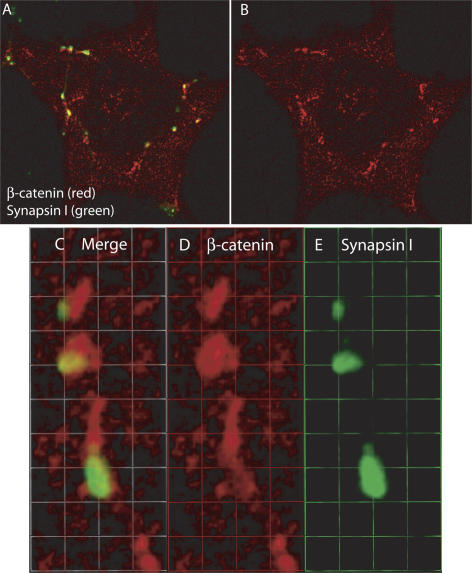
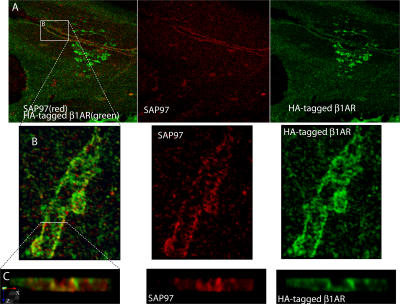
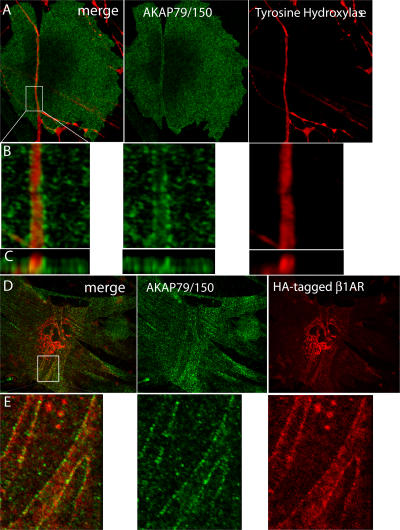
The sympathetic nervous system regulates cardiac function through the activation of adrenergic receptors (ARs). beta(1) and beta(2)ARs are the primary sympathetic receptors in the heart and play different roles in regulating cardiac contractile function and remodeling in response to injury. In this study, we examine the targeting and trafficking of beta(1) and beta(2)ARs at cardiac sympathetic synapses in vitro. Sympathetic neurons form functional synapses with neonatal cardiac myocytes in culture. The myocyte membrane develops into specialized zones that surround contacting axons and contain accumulations of the scaffold proteins SAP97 and AKAP79/150 but are deficient in caveolin-3. The beta(1)ARs are enriched within these zones, whereas beta(2)ARs are excluded from them after stimulation of neuronal activity. The results indicate that specialized signaling domains are organized in cardiac myocytes at sites of contact with sympathetic neurons and that these domains are likely to play a role in the subtype-specific regulation of cardiac function by beta(1) and beta(2)ARs in vivo.


Figures

Figure 1.
Figure 1.
Stimulation of SGNs by nicotine results in an increase in the beating rate of contacting myocytes. Myocytes and SGNs were cocultured on the same coverslip or on separate coverslips in the same culture dish. The change in myocyte contraction rate was monitored by video microscopy before and after the stimulation of SGNs with 1 μM nicotine tartrate. The data are the mean +/− SEM (error bars) of three experiments. Two-way analysis of variance demonstrated that there was a significantly greater increase in the beat rate of myocytes cocultured on the same coverslip with SGNs compared with myocytes and neurons cultured on separate coverslips (P < 0.0001). The increase of the beat rate over baseline was significant for both curves (P < 0.001).
Figure 2.
Figure 2.
Accumulation of synapsin at contact sites of SGNs and cardiac myocytes. (A) SGNs and cardiac myocytes at 9 d in coculture immunostained with an antibody to synapsin I (green) and caveolin-3 (red). (B) SGNs and cardiac fibroblasts at 9 d in coculture stained with antibody to synapsin I (green) and fibronectin (red). (C) Quantitative comparison of synapsin puncta formation in cocultures of SGNs and cardiac myocytes versus SGNs and cardiac fibroblasts. The number of puncta on 10 cells averaged over three experiments. The approximate sizes of synapsin I puncta were as follows: large, >1.0 μm; medium, 0.5–1.0 μm; small, <0.5 μm (n = 15 cells). A t test was used to determine significance (**, P < 0.01 for medium puncta; ***, P < 0.001 for large puncta). Error bars represent SEM.
Figure 3.
Figure 3.
Visualization of active synaptic sites in a coculture of cardiac myocytes and SGNs by uptake of an antibody to the luminal domain of synaptotagmin. A coculture of cardiac myocytes and SGNs was incubated with serum-free media containing 500 μM nicotine and 10 μg/ml rabbit polyclonal antibody to the luminal domain of synaptotagmin for 15 min followed by rinsing, fixation, and immunostaining with a mouse monoclonal antibody to synapsin I. (A) Brightfield image of the coculture. (B) Immunostaining for synaptotagmin (green). (C) Immunostaining for synapsin I (red). (D) Merged image of B and C.
Figure 4.
Figure 4.
Caveolin-3 is diminished at sites of contact between cardiac myocytes and SGNs. (A) Cardiac myocytes and SGNs at 9 d in coculture were immunostained with antibodies for caveolin-3 (red) and thyrosine hydroxylase (green) and were imaged by two-photon microscopy. (B) 3D reconstruction of an enlarged region of the boxed image in A. (C) X-z cross section of the 3D reconstruction.
Figure 5.
Figure 5.
Cadherins accumulate at sites of contact between cardiac myocytes and SGNs. (A) Cardiac myocytes and SGNs at 5 d in coculture were immunostained for tyrosine hydroxylase (green) and pancadherin (red). (B) Same image as in A showing only pancadherin immunostaining. (C) Cardiac myocytes and SGNs at 5 d in coculture were immunostained for synapsin I (green) and pancadherin (red). (D) Same image as in C showing only pancadherin immunostaining.
Figure 6.
Figure 6.
β-catenin accumulation at sites of contact between cardiac myocytes and SGNs. (A) Cardiac myocytes were cocultured with SGNs for 2 d, immunostained for β-catenin (red) and synapsin I (green), and imaged by two-photon microscopy. (B) Same image as in A showing only β-catenin immunostaining. (C–E) 3D-reconstructed enlarged fragment from A. 1 U = 1.4 μM.
Figure 7.
Figure 7.
β2AR is depleted at synaptic sites after stimulation of neuronal activity. Cardiac myocytes were cocultured with SGNs for 6 d, infected with recombinant adenovirus expressing FLAG-tagged β2AR, and cultured for an additional 48–72 h before immunostaining for FLAG (red) and synapsin I (green). (A and B) Nonstimulated cultures. (C and D) Example of β2AR removal by spontaneous neuronal activity in nonstimulated coculture. (E and F) Cocultures that were stimulated with 500 μM nicotine for 5 min. (G) Comparison of the fluorescence intensity of immunostaining for FLAG-tagged β2AR in synaptic and extrasynaptic areas after the stimulation of coculture with nicotine. The mean fluorescence intensity for the red channel representing immunostaining for FLAG-tagged β2AR was measured in areas where the green channel fluorescence (immunostaining for synapsin I) was selected as a criterion. Next, we excluded the area selected and measured the fluorescence for the red channel at extrasynaptic regions. Data were collected from 10 images obtained in three experiments. (H) Comparison of the fluorescence intensity of immunostaining for FLAG-tagged β2AR beneath synapsin I puncta and between synapsin I puncta along the axon after the stimulation of coculture with nicotine. To compare the fluorescence intensity of β2AR staining in the areas of synapsin I accumulation with areas along axons between synapsin I puncta, we used the Wizard tool of the Volocity program to select regions of interest. Data were obtained from three images using six different pairs of the region of interest on each image. (G and H) Measurements were performed in arbitrary units of the direct scale. Comparisons were performed with a t test. Statistical significance was set as P < 0.05. **, P < 0.01; ***, P < 0.001.
Figure 8.
Figure 8.
β1ARs accumulate at sites of contact between SGNs and cardiac myocytes. (A and B) Cardiac myocytes were cocultured with SGNs for 6 d, infected with recombinant adenovirus expressing HA-tagged β1AR, and cultured for an additional 24 h before immunostaining for HA (red) and synapsin I (green). (C and D) Cardiac myocytes were cocultured with SGNs for 6 d, infected with recombinant adenovirus expressing HA-tagged β1AR-PDZ, and cultured for an additional 24 h before immunostaining for HA (red) and synapsin I (green). Insets show enlargements of the images outlined by dotted white lines. (E–G) X-z cross section of the 3D reconstruction of a two-photon image of the site of contact between a cardiac myocyte expressing HA-tagged β1AR and an SGN immunostained for HA (red) and synapsin I (green). (H) Histogram of the fluorescence intensity along the red line in B. The red and blue lines indicate the boundaries of the axon bundle, which are represented by red and blue circles in B. (bottom) Comparison of the accumulation of β1AR in the zones of contact with SGNs. The histograms of fluorescence intensity of the original LSM510 files for five different images were used to quantify the accumulation of β1AR in the zones of contact with SGNs. The mean fluorescence intensity in the areas inside and outside the zones of contact along the selected straight line crossing a zone of contact was quantified (H; two zones from each image). Measurements were performed in arbitrary units of the direct scale. Statistic comparisons were performed with a t test. Error bars represent SEM. ***, P < 0.001.
Figure 9.
Figure 9.
SAP97 and β1ARs localize to cardiac sympathetic synapses in vitro. (A) Cardiac myocytes were cocultured with SGNs for 6 d, infected with recombinant adenovirus expressing HA-tagged β1AR, and cultured for an additional 24 h before immunostaining for HA (green) and SAP97 (red). Two-photon image. (B and C) Enlargements of the boxed area in A.
Figure 10.
Figure 10.
AKAP79/150 accumulates at cardiac sympathetic synapses in vitro. (A) Colocalization of AKAP79/150 and tyrosine hydroxylase. Cardiac myocytes and SGNs were cultured for 7 d and immunostained for tyrosine hydroxylase (red) and AKAP79/150 (green); two-photon image. (B) 3D-reconstructed enlarged fragment of the boxed area in A. (C) X-z cross section of the 3D reconstruction. (D) Colocalization of β1AR and AKAP79/150. Cardiac myocytes were cocultured with SGNs for 6 d, infected with recombinant adenovirus expressing HA-tagged β1AR, and cultured for an additional 24 h before immunostaining for HA (red) and AKAP79/150 (green); two-photon image. (E) 3D-reconstructed enlarged fragment of the boxed area in D.

References

    1. Armour, J.A., and J.L. Ardell. 1994. Neurocardiology. Oxford University Press, New York, NY. 443 pp.
    1. Bamji, S.X., K. Shimazu, N. Kimes, J. Huelsken, W. Birchmeier, B. Lu, and L.F. Reichardt. 2003. Role of beta-catenin in synaptic vesicle localization and presynaptic assembly. Neuron. 40:719–731. - PMC - PubMed
    1. Bauman, A.L., A.S. Goehring, and J.D. Scott. 2004. Orchestration of synaptic plasticity through AKAP signaling complexes. Neuropharmacology. 46:299–310. - PubMed
    1. Bernstein, D., G. Fajardo, M. Zhao, T. Urashima, J. Powers, G. Berry, and B.K. Kobilka. 2005. Differential cardioprotective/cardiotoxic effects mediated by beta-adrenergic receptor subtypes. Am. J. Physiol. Heart Circ. Physiol. 289:H2441–H2449. - PubMed
    1. Betz, W.J., and G.S. Bewick. 1992. Optical analysis of synaptic vesicle recycling at the frog neuromuscular junction. Science. 255:200–203. - PubMed

Publication types

MeSH terms