. 2007 Feb 20;104(8):2673-8.
doi: 10.1073/pnas.0611151104. Epub 2007 Feb 12.

A single-molecule barcoding system using nanoslits for DNA analysis

Affiliations

A single-molecule barcoding system using nanoslits for DNA analysis

Kyubong Jo et al. Proc Natl Acad Sci U S A. .

Abstract

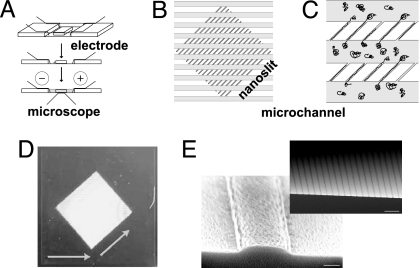
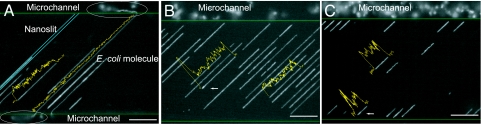
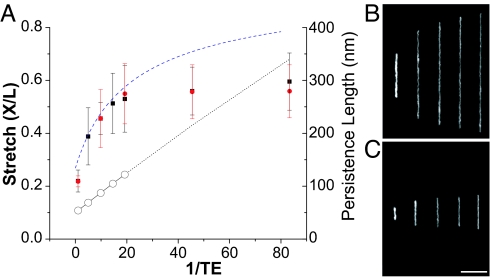
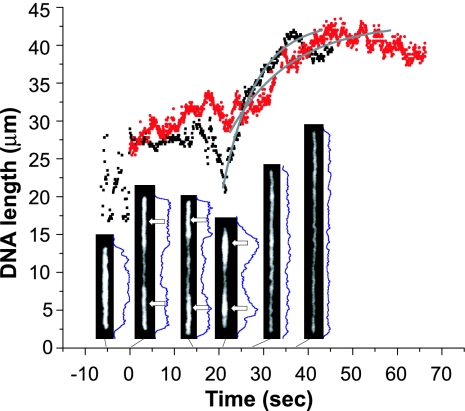
Molecular confinement offers new routes for arraying large DNA molecules, enabling single-molecule schemes aimed at the acquisition of sequence information. Such schemes can rapidly advance to become platforms capable of genome analysis if elements of a nascent system can be integrated at an early stage of development. Integrated strategies are needed for surmounting the stringent experimental requirements of nanoscale devices regarding fabrication, sample loading, biochemical labeling, and detection. We demonstrate that disposable devices featuring both micro- and nanoscale features can greatly elongate DNA molecules when buffer conditions are controlled to alter DNA stiffness. Furthermore, we present analytical calculations that describe this elongation. We also developed a complementary enzymatic labeling scheme that tags specific sequences on elongated molecules within described nanoslit devices that are imaged via fluorescence resonance energy transfer. Collectively, these developments enable scaleable molecular confinement approaches for genome analysis.


Conflict of interest statement

The authors declare no conflict of interest.

Figures

Fig. 1.
Fig. 1.
Microchannel–nanoslit device design and loading scheme. (A) Plexiglas slide (25.4 × 76.2 mm) with a rectangular opening to which a glass coverslip window (18 × 18 mm) is affixed with wax. The PDMS device is bonded to this window and immersed in buffer for electrokinetic loading via the indicated electrodes. Before buffer immersion, DNA is pipetted into microchannels for capillary loading. (B) Illustration (top view) shows nanoslits (diagonal, 100 nm high × 1 μm wide) overlaid with microchannels (horizontal, 3 μm × 100 μm wide). (C) Cartoon depicts relaxed and stretched DNA molecules occurring during electrokinetic loading within microchannels and nanoslits. (D) Photograph of silicon master mold bearing photoresist and etched features; arrows show the path of DNA molecules taken through the microchannel and nanoslit features. (E) Scanning electron micrograph of the silicon master shows a single nanoslit mold feature before the photoresist overlay, conferring microchannel features. (Scale bar, 300 nm.) The upper image shows many such nanoslit features spaced 4 μm apart (center-to-center). (Scale bar, 10 μm.)
Fig. 2.
Fig. 2.
Gallery of fluorescence micrographs shows stretched and relaxed DNA molecules within the nanoslit device after electrokinetic loading; images were taken a few minutes after the electric field was shut off. (A) A large E. coli DNA molecule spans across the 105-μm-long nanoslit (0.01× TE buffer) showing relaxed ends (circled) within abutting microchannels. (B) T4 DNA (166 kb) molecules; 0.05× TE. (C) λ DNA (48.5 kb) molecules; 0.01× TE. Green lines demarcate nanoslit–microchannel interfaces; blue indicates a nanoslit, and yellow lines show integrated fluorescence intensity profiles revealing folded ends (B and C, arrows). Relaxed molecules within the microchannel regions appear as diffuse, partly out-of-focus, fluorescent balls, whereas stretched molecules present as long, linear objects. (Scale bars, 20 μm.)
Fig. 3.
Fig. 3.
DNA stretch varies with TE concentration. (A) Ionic strength varied through successive 5-, 10-, 15-, 20-, 50-, and 100-fold dilutions of 1× TE buffer (ionic strength, 8.4 mM). The reciprocal TE buffer concentrations vs. the stretch of λ (black square) and T4 (red circle) DNA are plotted along with the calculated persistence length (Eq. 1) using ionic strengths determined from dilutions (solid line with open circles). A dotted line continues the calculated persistence length for ionic strengths at <0.5 mM, accounting for uncertainties associated with very low ionic strength. A dashed blue line represents a fitted curve using Eq. 12. The stretch is defined by apparent length (X) divided by the polymer contour length (L) of YOYO-1-stained DNA. Each data point represents measurements from 50 to 300 molecules; error bars show standard deviations on these means. (B and C) Fluorescence images (a combination of five separate experiments) show T4 DNA (B) and λ DNA (C) at five different TE dilutions, 1.002× (0.9980), 0.102× (9.80), 0.0520× (19.2), 0.0220× (45.5), and 0.0120× (83.3), with the corresponding dilution factors shown in parentheses. (Scale bar, 10 μm.)
Fig. 4.
Fig. 4.
T4 DNA relaxation within nanoslits after electrokinetic loading. Plots show the relaxation kinetics (0.4 mM ionic strength, New England Biolabs buffer 4) (see Materials and Methods) of two DNA molecules [the first (black) enters nanoslits in a folded state, and the second (red) is not significantly folded] gauged by apparent length measurements as a function of time; 0 s corresponds to the electric field being shut off. Six images of molecule 1 show evolution of fluorescence intensity profiles (blue traces) echoing conformational and length changes obtained at −5, 0, 14, 21, 27, and 37 s, with arrows indicating putatively folded regions flagged by increased fluorescence intensities. We interpret this analysis as indicating that molecule 1 enters a nanoslit highly folded, with both ends tucked in. After the field is shut off, folded arms appear, signaled by the fluorescence intensity profiles, and continue unfolding up to ≈40 s, until the entire molecule appears fully equilibrated at 50 s. Interestingly, at 21 s, the molecule shrinks (also at −5 s), then proceeds to relax in an exponential fashion; curve fits (gray lines) of molecules 1 and 2 show time constants of 7.4 and 13.7 s, respectively. For further details, see SI Movie 1.
Fig. 5.
Fig. 5.
Molecular barcoding scheme and maps of nicked, fluorochrome-labeled BAC molecules imaged by fluorescence microscopy. (Inset) First, DNA ligation and nick translation with ddNTPs obviate inherent nicks before barcoding; second, Nb.BbvCI places site-specific nicks on these molecules; and last, E. coli DNA polymerase I incorporates fluorochrome-labeled deoxyribonucleotides F-dCTP and F-dUTP (Alexa Fluor 647-aha-dCTP, dUTP) into nick sites. Fluorescence images of labeled DNA molecules (pseudocolored DNA backbones are green and FRET imaged punctates red) compared with expected labeling patterns (measured in kilobases) from sequence, and unity-based maps constructed from analyzed molecules (Materials and Methods) are shown for BAC79 (113.7 kb) (A), BAC150 (116.8 kb) (B), and BAC614 (82.5 kb) (C). Yellow arrows orient nick translation on DNA strands. DNA molecules were stretched in 0.01× TE buffer within described nanoslits. (Scale bar, 10 μm.)

References

    1. Margulies M, Egholm M, Altman WE, Attiya S, Bader JS, Bemben LA, Berka J, Braverman MS, Chen YJ, Chen ZT, et al. Nature. 2005;437:376–380. - PMC - PubMed
    1. Shendure J, Porreca GJ, Reppas NB, Lin XX, McCutcheon JP, Rosenbaum AM, Wang MD, Zhang K, Mitra RD, Church GM. Science. 2005;309:1728–1732. - PubMed
    1. Dimalanta ET, Lim A, Runnheim R, Lamers C, Churas C, Forrest DK, de Pablo JJ, Graham MD, Coppersmith SN, Goldstein S, et al. Anal Chem. 2004;76:5293–5301. - PubMed
    1. Jing J, Reed J, Huang J, Hu X, Clarke V, Edington J, Housman D, Anantharaman TS, Huff EJ, Mishra B, et al. Proc Natl Acad Sci USA. 1998;95:8046–8051. - PMC - PubMed
    1. Schwartz DC, Koval M. Nature. 1989;338:520–522. - PubMed

Publication types

LinkOut - more resources