

Excitation of polymer-shelled contrast agents with high-frequency ultrasound
- PMID: 17297826
- PMCID: PMC2675925
- DOI: 10.1121/1.2401270
Excitation of polymer-shelled contrast agents with high-frequency ultrasound
Abstract
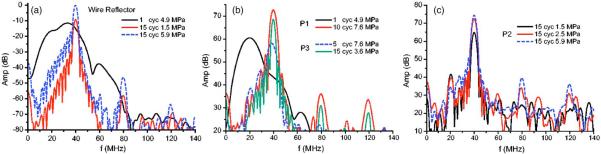
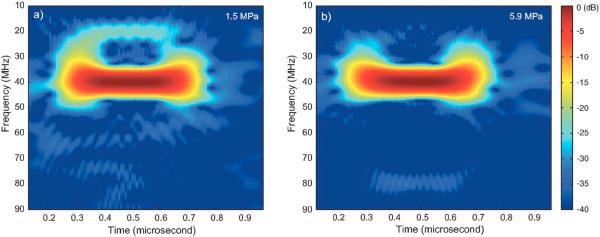
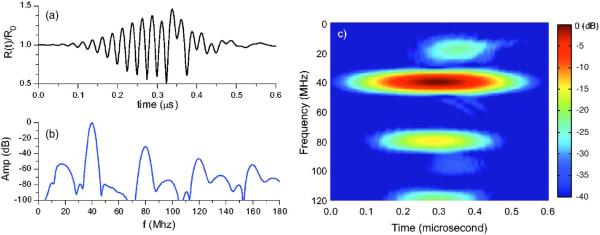
Few experimental and complementary theoretical studies have investigated high-frequency (>20 MHz) nonlinear responses from polymer-shelled ultrasound contrast agents. Three polymer agents with different shell properties were examined for their single-bubble backscatter when excited with a 40 MHz tone burst. Higher-order harmonic responses were observed for the three agents; however, their occurrence was at least partly due to nonlinear propagation. Only one of the agents (1.1 microm mean diameter) showed a subharmonic response for longer excitations (approximately 10-15 cycles) and midlevel pressure excitations ( 2.5 MPa). Theoretical calculations of the backscattered spectrum revealed behavior similar to the experimental results in specific parameter regimes.
Figures
References
-
- Morgan K, Dayton P, Klibanov A, Brandenburger G, Kaul S, Wei K, Ferrara K. Properties of contrast agents insonified at frequencies above 10 MHz. IEEE Ultrason. Symp. 1996:1127–1130.
-
- Deng CX, Lizzi FL, Silverman RH, Ursea R, Coleman DJ. Imaging and spectrum analysis of contrast agents in the in vivo rabbit eye using very-high-frequency ultrasound. Ultrasound Med. Biol. 1998;24:383–394. - PubMed
-
- Moran CM, Watson RJ, Fox KA, McDicken WN. In vitro acoustic characterization of four intravenous ultrasonic contrast agents at 30 MHz. Ultrasound Med. Biol. 2002;28:785–791. - PubMed
-
- Goertz DE, Cherin E, Needles A, Karshafian R, Brown AS, Burns PN, Foster FS. High frequency nonlinear b-scan imaging of microbubble contrast agents. IEEE Trans. Ultrason. Ferroelectr. Freq. Control. 2005;52:65–79. - PubMed
-
- Allen JS, Kruse DE, Ferrara KW. Shell waves and acoustic scattering from ultrasound contrast agents. IEEE Trans. Ultrason. Ferroelectr. Freq. Control. 2001;48:409–418. - PubMed
Publication types
MeSH terms
Substances
Grants and funding
LinkOut - more resources
Full Text Sources