. 2007 Feb;7(2):415-20.
doi: 10.1021/nl0626784.

Using polarization-shaped optical vortex traps for single-cell nanosurgery

Affiliations

Using polarization-shaped optical vortex traps for single-cell nanosurgery

Gavin D M Jeffries et al. Nano Lett. 2007 Feb.

Abstract

Single-cell nanosurgery and the ability to manipulate nanometer-sized subcellular structures with optical tweezers has widespread applications in biology but so far has been limited by difficulties in maintaining the functionality of the transported subcellular organelles. This difficulty arises because of the propensity of optical tweezers to photodamage the trapped object. To address this issue, this paper describes the use of a polarization-shaped optical vortex trap, which exerts less photodamage on the trapped particle than conventional optical tweezers, for carrying out single-cell nanosurgical procedures. This method is also anticipated to find broad use in the trapping of any nanoparticles that are adversely affected by high-intensity laser light.


Figures

Figure 1
Figure 1
Optical setup and intensity profiles of polarization-shaped vortex traps. (a) The 1064nm line of a Nd:YAG laser (TEM00) was directed through a computer generated hologram (CGH), after which the LG0+1 mode as isolated and sent into an oil immersion objective (100×; N.A. 1.3). The top circular inset shows a SEM image of the dislocation region in the CGH, which was fabricated in SU-8 patterned on glass. The lower inset shows the LG0+1 and LG01 modes formed after the CGH; the conversion efficiencies are shown below the image of each mode. (b-d) Experimentally measured image showing the profile of a right circularly polarized (b), left circularly polarized (c), and linearly polarized (d) LG0+1 beam; the intensity distributions were visualized by detecting the two-photon fluorescence of a trapped 3μm dye-doped bead (excitation maximum at 542nm). (e-g) are simulations showing the corresponding two-photon intensity distributions, which match well with our experimental measurements. (h-j) are intensity plots along the direction indicated by the lines drawn in (e-g), with the scale bar in h corresponding to 1064nm. Fluorescence images were obtained using a CCD camera. M = mirror; L = lens.
Figure 2
Figure 2
Analysis of particle trapping position and fluorescence response. (a) Using trapping potentials derived from the intensity distributions, we calculated the trapping position of different size particles in a linearly polarized vortex trap. Y-axis denotes the displacement of the particle in units of wavelength from the center (position zero) of the trap. As the size of the particles increases, they transition from being trapped at the high-intensity lobes to being centered over the dark core. The hatched region is where we calculated and experimentally observed that the particle can be trapped either at the high-intensity lobes or occupy the dark core, depending on the trapping power we use and the shape and refractive index of the particle. The insets are experimental images showing the two-photon fluorescence recorded from two 100nm beads trapped at the two high-intensity lobes (left inset) and a 1μm bead (right inset) trapped at the center of a linearly-polarized vortex trap. (b) A plot of recorded photon count (ordinate) versus laser power (abscissa) for a single 2μm fluorescent bead (Excitation Max: 505nm; Emission Max: 515nm) held and excited in a conventional Gaussian optical tweezer at 1064nm. The inset shows a plot of the log of the photon count (ordinate) versus the log of the laser power (abscissa) for powers up to 300mW; here the slope of the line is 2.0±0.2. The slope increased to 2.9±0.1 when fitted with powers between 500mW and 750mW.
Figure 3
Figure 3
(a-h) Two-photon fluorescence images of trapped beads in Gaussian (a-d), right circularly polarized (e, f), and linearly polarized (g, h) vortex traps. The sizes of the beads are 3μm (a, e), 1μm (b, f), 0.5μm (c, g), and 0.1μm (d, h), respectively. The powers at the object plane were 40mW in (a, e), 40mW in (b, f), 65mW in (c, g) and 130mW in (d, h). Scale bar represents 1μm. The images are scaled to aid in display of the bead, which leads to a slight drop in resolution, mostly seen in the 100nm bead (d, h). (i) Simulation showing the 3D profiles formed after focusing through a NA 1.3 objective of the three types of traps we used (Top: Gaussian; Left: linearly polarized vortex; Right: right circularly polarized vortex); the arrow points to the location of the maximum intensity and where a sub 400nm particle would be trapped. For all experiments, we used linear polarization for 100nm and 500nm beads and right circularly polarized light for 1μm and 3μm beads. (j, k) show the ratio (Gaussian/Vortex) of experimentally measured (dark blue bar) and simulated (light blue bar) two-photon fluorescence from fluorescent beads of four different diameters (labeled on the x-axis); the same laser powers as in (a-h) were used. All simulations used a pure LG01 mode, except for the one shown in the inset, which used 88% LG01, 10% of LG02, and 2% of LG03. (l) shows the ratio (Gaussian/Vortex) of the lateral trapping force obtained from experiments (dark blue bar) and simulations (light blue bar). The trapping powers were set to obtain an equal trapping force at the object plane for the different traps; these powers were, for the Gaussian and vortex respectively, 64mW & 220mW for 100nm, 6.0mW & 11.6 mW for 500nm, 5.0mW & 9.4mW for 1μm, and 8.9mW & 6.2mW for 3μm beads. The reported values were obtained by translating the bead at a 45° angle with respect to the side lobes. (m, n) shows the difference in the observed two-photon fluorescence after normalization to the differences in the trapping force between the different traps. Ratios of two-photon fluorescence were displayed using both total intensity (where intensity values recorded from all parts of the illuminated bead were used) and maximum intensity (where the intensity value from only the brightest pixel was used).
Figure 4
Figure 4
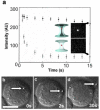
(a) A time plot that compares photobleaching of trapped mitochondria (stained with Mitotracker Green dye) in a conventional optical tweezer and in a linearly polarized vortex trap (laser power is 75mW at the object plane). To check for fluorescence, the trapped and stained mitochondria were illuminated periodically with 488nm excitation from an Ar+ laser; the fluorescence observed under 488nm excitation (ordinate) was plotted as a function of trapping time (abscissa). (○) Represents mitochondria trapped in the optical tweezer and (●) for mitochondria held in the vortex trap. The insets show fluorescence images (obtained using 488nm illumination) of mitochondria trapped for 15s (arrows) in the optical tweezer and in the vortex trap. (b-d) A sequence of images showing the removal of a fluorescent lysosome (stained with Lysotracker Green dye) from a B-lymphocyte. To cause the cell membrane to become more fluid, the lymphocyte was swelled by the addition of 25% (v/v) water in cell culture medium (RPMI 1640); the trapped lysosome (at 75mW trapping power at the object plane) was translated directly across the cell membrane and extracted from the cell. Scale bar = 10μm in (a).

Similar articles

Cited by

References

    1. Heilmann I, Pidkowich MS, Girke T, Shanklin J. Proceedings of the National Academy of Sciences of the United States of America. 2004;101(28):10266–10271. - PMC - PubMed
    1. Tu BP, Kudlicki A, Rowicka M, McKnight SL. Science. 2005;310(5751):1152–1158. - PubMed
    1. Hochedlinger K, Jaenisch R. Nature. 2006;441(7097):1061–1067. - PubMed
    1. Hochedlinger K, Rideout WM, Kyba M, Daley GQ, Blelloch R, Jaenisch R. Hematology Journal. 2004;5:S114–S117. - PubMed
    1. Ashkin A, Dziedzic JM, Bjorkholm JE, Chu S. Optics Letters. 1986;11(5):288–90. - PubMed

Publication types