Pre-steady-state decoding of the Bicoid morphogen gradient
- PMID: 17298180
- PMCID: PMC1790957
- DOI: 10.1371/journal.pbio.0050046
Pre-steady-state decoding of the Bicoid morphogen gradient
Abstract
Morphogen gradients are established by the localized production and subsequent diffusion of signaling molecules. It is generally assumed that cell fates are induced only after morphogen profiles have reached their steady state. Yet, patterning processes during early development occur rapidly, and tissue patterning may precede the convergence of the gradient to its steady state. Here we consider the implications of pre-steady-state decoding of the Bicoid morphogen gradient for patterning of the anterior-posterior axis of the Drosophila embryo. Quantitative analysis of the shift in the expression domains of several Bicoid targets (gap genes) upon alteration of bcd dosage, as well as a temporal analysis of a reporter for Bicoid activity, suggest that a transient decoding mechanism is employed in this setting. We show that decoding the pre-steady-state morphogen profile can reduce patterning errors caused by fluctuations in the rate of morphogen production. This can explain the surprisingly small shifts in gap and pair-rule gene expression domains observed in response to alterations in bcd dosage.
Conflict of interest statement
Figures


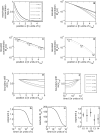
 , while the time t is in units of the decay time τ. (B) Same as in (A), except that each profile was rescaled such that it has unit concentration at x = 0 and decays to 1/e at x = 1. Note the logarithmic scale. At early times, the profile tail decays super-exponentially, while at later times the morphogen distribution is well approximated by an exponential. (C) Alteration of the steady-state morphogen concentration upon 2-fold reduction in morphogen production rate. The original profile corresponds to the solid line and the altered profile to the dotted line. Note that the indicated positional shifts Δx = |x − x′| at different morphogen thresholds do not depend on the position x. (D) Same as in (C) but for the pre-steady-state profile. (E) The shift Δx is shown as a function of x for different times t (see legend in [A]). For pre-steady-state profiles, Δx decreases as a function of x. (F) The shift Δx as a function of time t is shown for different positions x, as indicated. While at late times the shift is almost independent of the position, at early times the shift decreases with increasing distance from the source. (G) The exact solution for the pre-steady-state profile was fitted to the phenomenological approximation Mp(x, t) = M
0(t) exp[−(x/λ(t))p
(t)]. The best-fitted exponent p is shown as a function of time (in units of the decay time τ). (H) To estimate the deviation of the time-dependent solution from an exponential, we compared the residual error obtained for the best-fit p approximation (Rp) to the residual error obtained when fitting to exponential with p =1 (R
lin). The ratio of these residual errors is shown as a function of time. (I) The best-fitted exponent p for quantitative Bcd profiles corresponding to wild-type embryos between cycles 10 and 14. Data were downloaded from the FlyEx database [56]. For embryos in cycles 10–12, the average p is significantly larger than 1, indicating superexponential decay, while Bcd profiles at cycles 13 and 14 are consistent with p = 1. Note, however, the large fluctuations.

References
-
- Wolpert L. Positional information and the spatial pattern of cellular differentiation. J Theor Biol. 1969;25:1–47. - PubMed
-
- Briscoe J, Ericson J. The specification of neuronal identity by graded Sonic Hedgehog signalling. Semin Cell Dev Biol. 1999;10:353–362. - PubMed
-
- Neumann CJ, Cohen SM. Long-range action of Wingless organizes the dorsal-ventral axis of the Drosophila wing. Development. 1997;124:871–880. - PubMed
-
- Nellen D, Burke R, Struhl G, Basler K. Direct and long-range action of a DPP morphogen gradient. Cell. 1996;85:357–368. - PubMed
-
- McDowell N, Gurdon JB. Activin as a morphogen in Xenopus mesoderm induction. Semin Cell Dev Biol. 1999;10:311–317. - PubMed
Publication types
MeSH terms
Substances
LinkOut - more resources
Full Text Sources
Other Literature Sources
Molecular Biology Databases
Miscellaneous

