. 2007 Mar;5(3):e39.
doi: 10.1371/journal.pbio.0050039.

Absence of Ret signaling in mice causes progressive and late degeneration of the nigrostriatal system

Affiliations

Absence of Ret signaling in mice causes progressive and late degeneration of the nigrostriatal system

Edgar R Kramer et al. PLoS Biol. 2007 Mar.

Abstract

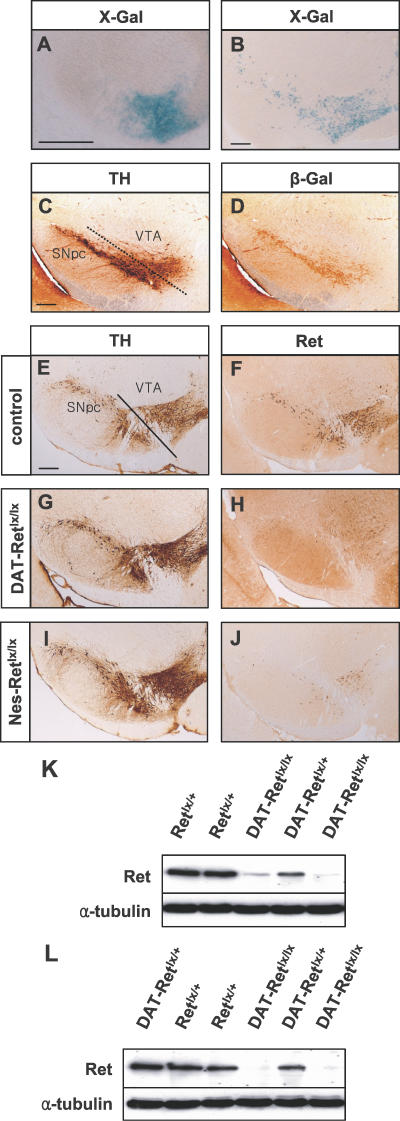
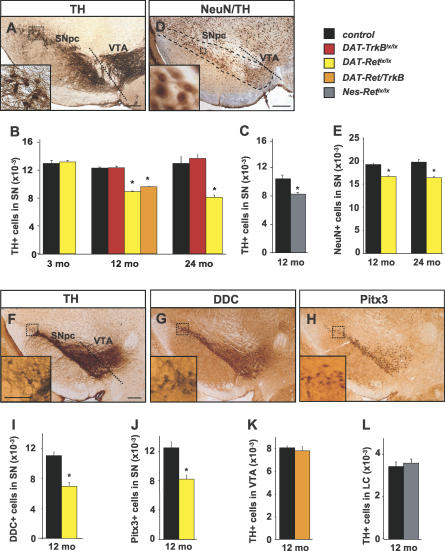
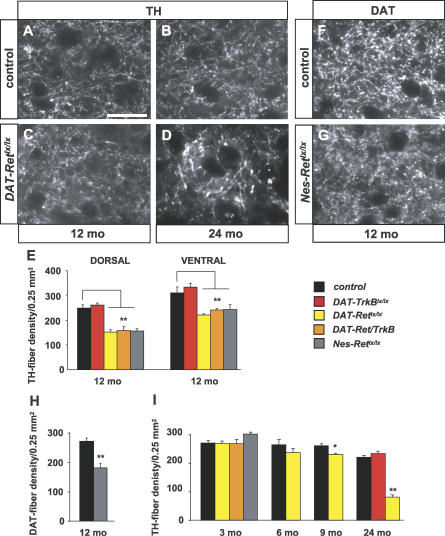
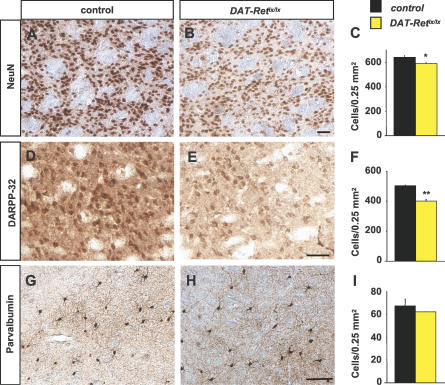
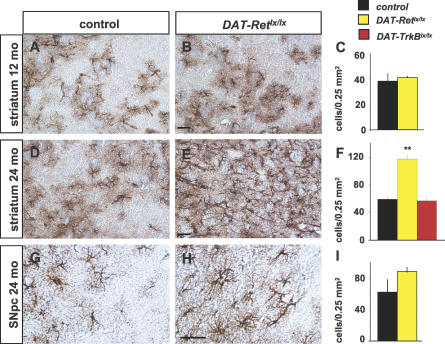
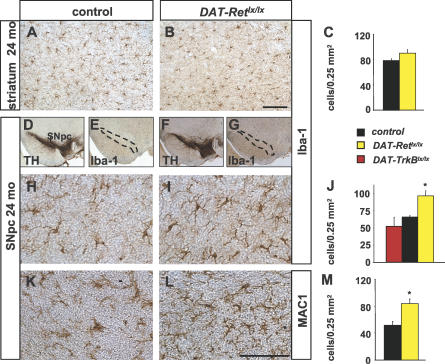
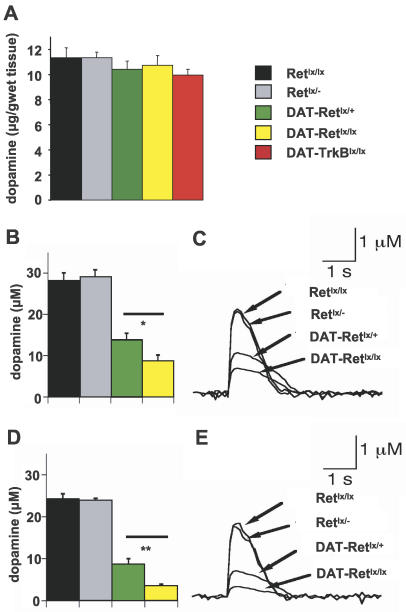
Support of ageing neurons by endogenous neurotrophic factors such as glial cell line-derived neurotrophic factor (GDNF) and brain-derived neurotrophic factor (BDNF) may determine whether the neurons resist or succumb to neurodegeneration. GDNF has been tested in clinical trials for the treatment of Parkinson disease (PD), a common neurodegenerative disorder characterized by the loss of midbrain dopaminergic (DA) neurons. BDNF modulates nigrostriatal functions and rescues DA neurons in PD animal models. The physiological roles of GDNF and BDNF signaling in the adult nigrostriatal DA system are unknown. We generated mice with regionally selective ablations of the genes encoding the receptors for GDNF (Ret) and BDNF (TrkB). We find that Ret, but not TrkB, ablation causes progressive and adult-onset loss of DA neurons specifically in the substantia nigra pars compacta, degeneration of DA nerve terminals in striatum, and pronounced glial activation. These findings establish Ret as a critical regulator of long-term maintenance of the nigrostriatal DA system and suggest conditional Ret mutants as useful tools for gaining insights into the molecular mechanisms involved in the development of PD.


Conflict of interest statement

Competing interests. The authors have declared that no competing interests exist.

Figures

Figure 1
Figure 1. Conditional Ablation of Ret Expression in the Nigrostriatal System
(A–D) Recombination efficiency of DAT-Cre mice crossed with Rosa26R lacZ reporter mice (DAT-Rosa26R). β-galactosidase (X-Gal) activity (blue) in coronal brain sections of DAT-Rosa26R transgenic mice at embryonic day E15.5 (A) and at 3-mo postnatal (B). Anti- TH (C) and anti–β-galactosidase (β-Gal) (D) immunostaining in adjacent brain sections of 2-y-old DAT-Rosa26R mice. Cre activity is restricted to SNpc and VTA. (E–J) Immunohistochemical detection of TH (E, G, and I) and Ret (F, H, and J) in adjacent coronal brain sections of 3-mo-old wild-type (wt), DAT-Retlx/lx, and Nes-Retlx/lx mice. Note the nearly complete removal of Ret immunoreactivity in SNpc and VTA of DAT-Retlx/lx and Nes-Retlx/lx mice. (K and L) Western blot analysis of Ret protein levels in protein lysates from SNpc (K) and striatum (L) of 3-mo-old control (Retlx/+and DAT-Retlx/+) and DAT-Retlx/lx mutant mice. Immunoblots were reprobed with anti–α-tubulin antibodies as loading controls.
Figure 2
Figure 2. Progressive Loss of Nigral DA Neurons in DAT-Retlx/lx Mice
(A) Coronal brain section of a 3-mo-old wild-type mouse showing DA neurons in the SNpc and the VTA stained with an antibody against TH. The inset shows a higher magnification view of the stippled area. (B and C) Stereological quantification of TH-positive DA neurons in the SNpc of 3-, 12-, and 24-mo-old control, DAT-TrkBlx/lx, DAT-Retlx/lx, and double homozygous Dat-Ret/TrkB mice (C) (n = 3 mice per genotype), Nes-Retlx/lx mutant mice and littermate controls (D) (n = 4 mice per genotype). *, p < 0.05 (Student t-test). (D) Double immunostaining for NeuN and TH (very mild staining protocol to outline the SNpc [stippled area]). The inset shows a higher magnification view of the stippled box, displaying nuclear localization for NeuN and cytoplasmic immunoreactivity for TH. (E) Stereological quantification of NeuN-positive neurons in the SNpc of 12- and 24-mo-old control and DAT-Retlx/lx mice (n = 5 mice per genotype at 12 mo, and n = 4 mice per genotype at 24 mo). *, p < 0.0001 and p < 0.001 for 12- and 24-mo-old DAT-Retlx/lx mice, respectively (Student t-test). (F–H) Adjacent sections of SNpc and VTA of a 1-y-old wild-type mouse stained for TH (F), dopa-decarboxylase (G), and Pitx3 (H). Insets show higher magnification images. (I and J) Stereological quantification of DDC-positive (I) and Pitx3-positive (J) cells in the SNpc of 12-mo-old littermate control and DAT-Retlx/lx mice (n = 3 mice per genotype). *, p < 0.05 (Student t-test). (K and L) Stereological quantification of TH-positive cells in the VTA region of 1-y-old control and DAT-Ret/TrkB mutant mice (K) (n = 3 mice per genotype; p > 0.5; Student t-test) and in the LC of 12-mo-old control and Nes-Retlx/lx mutant mice (L) (n = 4 mice per genotype; p >0.5; Student t-test). Scale bar indicates 250 μm and, in insets, 100 μm.
Figure 3
Figure 3. Progressive Loss of Striatal Innervation in DAT-Retlx/lx, but Not DAT-TrkBlx/lx Mice
(A–D, F, and G) Representative images of dorsal striatum stained by immunofluorescence using antibodies against TH (A–D) and DAT (F and G) of control (A, B, and F) and DAT-Retlx/lx mutants (C, D, and G) at 12 (A, C, F, and G) and 24 mo of age (B and D). (E) The innervation density based on anti-TH immunofluorescence was quantified in dorsal versus ventral striatum of 12-mo-old controls (n = 16) versus DAT-TrkBlx/lx (n = 4), DAT-Retlx/lx (n = 6), double DAT-Ret/TrkB (n = 5), and Nes-Retlx/lx mutants (n = 7). DAT-Retlx/lx, double DAT-Ret/TrkB, and Nes-Retlx/lx mutants showed significant reductions in TH fiber density in dorsal (p < 0.001) and ventral striatum (p < 0.001, p < 0.01, and p < 0.01 for DAT-Retlx/lx, double DAT-Ret/TrkB, and Nes-Retlx/lx mutants, respectively). **, p < 0.01 (Student t-test). (H) The innervation density based on anti-DAT immunofluorescence was quantified in 12-mo-old Nes-Retlx/lx mutants compared to age-matched controls (n = 4 per genotype; p < 0.001, Student t-test). (I) Time course of TH-positive fiber loss from 3 to 24 mo of age. DAT-Retlx/lx mutant mice show a progressive fiber loss, starting at 6 to 9 mo (p = 0.09 and p < 0.05 at 6 mo and 9 mo, respectively) and maximizing at 24 mo (p < 0.0001). DAT-TrkBlx/lx mutant mice do not show any signs of fiber loss even at 24 mo of age (p = 0.13). *, p < 0.05; **, p < 0.01 (Student t-test). Scale bar indicates 25 μm.
Figure 4
Figure 4. Loss of Postsynaptic Target Cells but Not Local Striatal Interneurons in DAT-Retlx/lx Mice
Immunohistochemical stainings of dorsal striatum of 2-y-old control (A, D, and G) and DAT-Retlx/lx mutants (B, E, and H) for NeuN (A and B), DARPP-32 (D and E), or parvalbumin (G and H). Histograms showing the number of NeuN-positive (C), DARPP-32–positive (F), and parvalbumin-positive cells (I) in DAT-Retlx/lx mutants and age-matched controls (n = 3–5 each genotype). Note also the reduced staining intensities for NeuN and DARPP-32 in DAT-Retlx/lx compared to control mice. *, p < 0.05; **, p < 0.01 (Student t-test). Scale bars indicate 50 μm.
Figure 5
Figure 5. Gliosis in Dorsal Striatum of DAT-Retlx/lx Mice
(A, B, D, E, G, and H) Bright-field photomicrographs of dorsal striatum (A, B, D, and E) and SNpc (G and H) of 12-mo-old (A and B) and 24-mo-old (D, E, G, and H) control (A, D, and G) and DAT-Retlx/lx mutants (B, E, and H) stained for GFAP. (C, F, and I) Histograms showing the number of GFAP-positive reactive astrocytes (n = 3–5 per genotype). There is a 2-fold increase in the number of reactive astrocytes in the striatum of 2-y-old DAT-Retlx/lx mutants as compared to wild-type controls and DAT-TrkBlx/lx mutants (F) (p < 0.0001), whereas no difference is seen in 12-mo-old DAT-Retlx/lx mutants compared to controls (C) (p = 0.9). No significant increase in the number of reactive astrocytes is seen in the SNpc of 24-mo-old DAT-Retlx/lx mutants compared to controls (I) (p = 0.24). **, p < 0.01 (Student t-test). Scale bars indicate 50 μm.
Figure 6
Figure 6. Inflammation in SNpc of DAT-Retlx/lx Mice
(A, B, D–I, K, and L) Immunohistochemical stainings of dorsal striatum (A and B) and SNpc (D–I, K, and L) of 24-mo-old control (A, D, E, H, and K) and DAT-Retlx/lx mice (B, F, G, I, and L) for Iba-1 (A, B, E, G, H, and I), TH (D and F), and MAC1 (K and L). To localize microglial cells in SNpc, adjacent sections were stained for TH, and the area of the SNpc was marked and copied to the adjacent section stained for macrophages. (C, J, and M) Histograms showing the number of Iba-1–positive (C and J) and MAC1-positive (M) cells in the striatum (C) and SNpc (J and M) of 24-mo-old (C and J) DAT-Retlx/lx mice and controls. No significant alterations in the numbers of Iba-1–positive cells were observed in the striatum of 24-mo-old mutants and controls ([C] n = 4, p = 0.065). A significant increase in the numbers of Iba-1–positive cells was observed in the SNpc of 24-mo-old DAT-Retlx/lx mice compared to controls (J) (n = 5, p < 0.05). The same result was obtained using MAC1 as a second independent microglial marker (M) (n = 3, p < 0.05). *, p < 0.05 (Student t-test). Scale bars indicate 100 μm.
Figure 7
Figure 7. Reduced Dopamine Release in the Striatum of DAT-Retlx/lx Mice
(A) Total dopamine levels normalized to 2,3-dihydroxybenzoic acid (DHBA) and expressed relative to the weight of wet striatum (grams) of 2-y-old control mice (Retlx/lx), heterozygous Retlx/−, heterozygous DAT-Retlx/+, homozygous DAT-Retlx/lx, and DAT-TrkBlx/lx mice. Note the minor reduction of total dopamine levels in all mice carrying the DAT-Cre knock-in construct. (B–E) Evoked dopamine release after electrical stimulation in the dorsal striatum of control mice (Retlx/lx and Retlx/− mice), heterozygous DAT-Retlx/+ mice, and homozygous DAT-Retlx/lx mice of 1 y (B and C) or 2 y (D and E) of age. In both age groups, there is a significant decrease of released dopamine in the mice carrying the DAT-Cre knock-in construct compared to controls. There is a further significant decrease in the homozygous DAT-Retlx/lx mice due to the lack of Ret (n = 5 per genotype, p < 0.05, Student t-test). *, p < 0.05; **, p < 0.01 (Student t-test). (C and E) Representative traces of single evoked dopamine release in different control and mutant mice.

References

    1. Forman MS, Lee VM, Trojanowski JQ. Nosology of Parkinson's disease: Looking for the way out of a quagmire. Neuron. 2005;47:479–482. - PubMed
    1. Hunot S, Hirsch EC. Neuroinflammatory processes in Parkinson's disease. Ann Neurol. 2003;53(Suppl 3):S49–S58. - PubMed
    1. Bezard E, Gross CE, Brotchie JM. Presymptomatic compensation in Parkinson's disease is not dopamine-mediated. Trends Neurosci. 2003;26:215–221. - PubMed
    1. Dauer W, Przedborski S. Parkinson's disease: Mechanisms and models. Neuron. 2003;39:889–909. - PubMed
    1. Abou-Sleiman PM, Muqit MM, Wood NW. Expanding insights of mitochondrial dysfunction in Parkinson's disease. Nat Rev Neurosci. 2006;7:207–219. - PubMed

Publication types

MeSH terms

Substances