. 2007 Mar;5(3):e57.
doi: 10.1371/journal.pbio.0050057.

Genome-wide profiling and analysis of Arabidopsis siRNAs

Affiliations

Genome-wide profiling and analysis of Arabidopsis siRNAs

Kristin D Kasschau et al. PLoS Biol. 2007 Mar.

Abstract

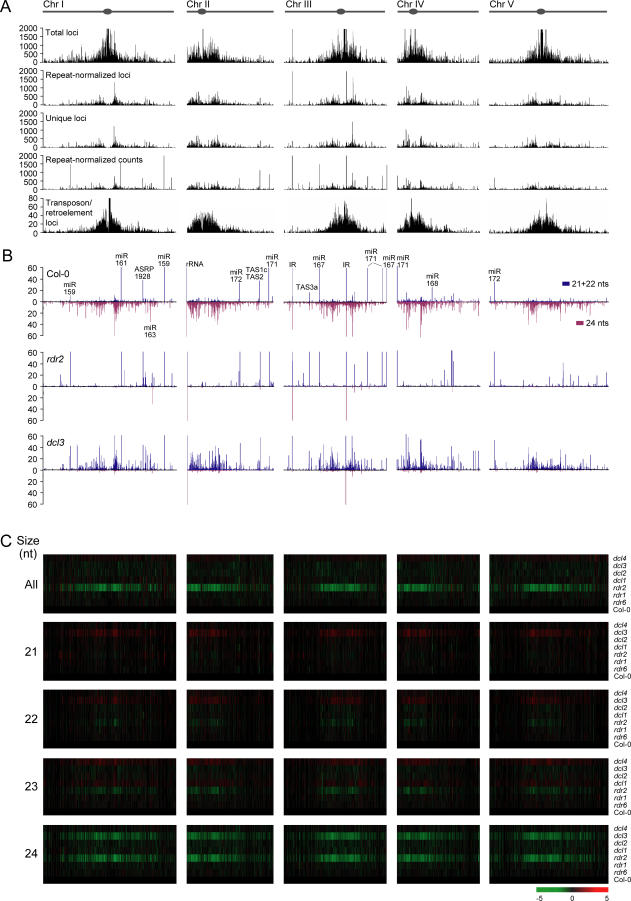
Eukaryotes contain a diversified set of small RNA-guided pathways that control genes, repeated sequences, and viruses at the transcriptional and posttranscriptional levels. Genome-wide profiles and analyses of small RNAs, particularly the large class of 24-nucleotide (nt) short interfering RNAs (siRNAs), were done for wild-type Arabidopsis thaliana and silencing pathway mutants with defects in three RNA-dependent RNA polymerase (RDR) and four Dicer-like (DCL) genes. The profiling involved direct analysis using a multiplexed, parallel-sequencing strategy. Small RNA-generating loci, especially those producing predominantly 24-nt siRNAs, were found to be highly correlated with repetitive elements across the genome. These were found to be largely RDR2- and DCL3-dependent, although alternative DCL activities were detected on a widespread level in the absence of DCL3. In contrast, no evidence for RDR2-alternative activities was detected. Analysis of RDR2- and DCL3-dependent small RNA accumulation patterns in and around protein-coding genes revealed that upstream gene regulatory sequences systematically lack siRNA-generating activities. Further, expression profiling suggested that relatively few genes, proximal to abundant 24-nt siRNAs, are regulated directly by RDR2- and DCL3-dependent silencing. We conclude that the widespread accumulation patterns for RDR2- and DCL3-dependent siRNAs throughout the Arabidopsis genome largely reflect mechanisms to silence highly repeated sequences.


Conflict of interest statement

Competing interests. The authors have declared that no competing interests exist.

Figures

Figure 1
Figure 1. Small RNA Sequencing and the Distribution of Small RNA Loci in Feature Classes
(A) Flowchart for high-throughput sequencing and analysis of small RNAs. (B–G) Distribution of small RNAs from wt Col-0 plants and rdr6–15, rdr1–1, rdr2–1, dcl1–7, dcl2–1, dcl3–1, and dcl4–2 mutants in the genome (B), transposons and retroelements (C), genes (D), pseudogenes (E), miRNAs (F), and tasiRNAs (G). In (B), the percentages of small RNAs in each of four size classes within each library are presented. In all other panels, normalized small RNA levels in each feature class are presented.
Figure 2
Figure 2. Distribution of Small RNA-Generating Loci from Each Chromosome
(A) Scrolling-window analysis (50,000-nt window and 10,000-nt scroll) of small RNA loci. Total, repeat-normalized, and unique small RNA loci, as well as transposon/retroelement loci, are shown. Abundance of repeat-normalized, library-size-normalized counts (individual sequencing reads) are also shown. (B) Scrolling-window analysis of repeat-normalized, library-size-normalized small RNA abundance in Col-0, rdr2, and dcl3. The summed, 21- and 22-nt size classes (blue, above x-axis) and 24-nt size class (red, below x-axis) were plotted independently. Note that in both (A and B), maximum values plotted were capped at the value corresponding to the maximum y-axis value. (C) Scrolling-window analysis of relative increase (red) or decrease (green) in repeat-normalized, library-size-normalized small RNA abundance in each mutant. Col-0 inflorescence was used as the reference library.
Figure 3
Figure 3. Small RNAs from Segments of Selected Transposons, Retroelements, and Pseudogenes
Each unique small RNA is indicated and color-coded based on size.
Figure 4
Figure 4. Analysis of Small RNAs Proximal to Transposons and Retroelements (T/R)
(A) Method to analyze over- or underrepresentation of small RNAs in T/R bins. (B and C) Z-score plots showing overrepresentation (positive) or underrepresentation (negative) of small RNA loci in T/R bins from wt Col-0 and mutant plants. Independent analyses were done for each size class from total (B) and unique (C) small RNA loci.
Figure 5
Figure 5. Small RNA Loci in Protein-Coding Genes and Pseudogenes
The percentage of genes (orange) and pseudogenes (blue) with 0, 1–5, 6–10, etc., small RNA loci was plotted.
Figure 6
Figure 6. Analysis of Small RNA Clusters in or around Genes
(A) Raw expression values in Col-0 inflorescence tissues for genes with clusters up to 1,000 nt upstream (5′) of the transcription start site, within the gene, and 1,000 nt downstream of the 3′ end. Genes are represented as points at positions corresponding to distance from a cluster. (B) Three random gene sets, containing the same numbers of genes (n) as in the 5′, 3′, and internal cluster sets, were randomly distributed within the respective zones. Red lines in (A and B) represent the mean expression of 1,000 random sets. (C) Scrolling-window counts of clusters (top), and Z-score showing over- or underrepresentation of clusters at positions relative to 5′, internal, and 3′ sites (bottom). Cluster counts and Z-score values were determined in 20-nt windows with a 10-nt scroll for observed clusters (blue), and for 1,000 sets of randomly distributed clusters that were averaged at each position (red). Figures below each panel indicate the gene region plotted along the x-axis, with arrows indicating the transcription start sites. Gray boxes mark the intragenic regions plotted on a relative scale (0–100). For each graph, the three independent analyses (5′, 3′, and transcribed regions) were merged in the same plots.
Figure 7
Figure 7. Accumulation of Cluster-Associated Small RNA Size Classes in and around Protein-Coding Genes and Pseudogenes in Col-0 and Mutant Plants
Col-0 (A), rdr1–1 (B), rdr2–1 (C), rdr6–15 (D), dcl1–7 (E), dcl2–1 (F), dcl3–1 (G), and dcl4–2 (H). The scrolling-window method was the same as that presented in Figure 6. The 5′ upstream, 3′ downstream, and transcribed regions were analyzed independently for the cluster-proximal genes. For the cluster-proximal pseudogenes, 5′ upstream, 3′ downstream, and internal pseudogene regions, based on annotation, were analyzed independently. For each graph, the three independent analyses were merged in the same plots.
Figure 8
Figure 8. Analysis of the Affect of rdr2 and dcl3 on the Expression of Cluster-Proximal Genes
(A and B) Fold-change in rdr2 (upper) and dcl3 (lower) versus Col-0 inflorescence plotted the same way as in Figure 6A for cluster-proximal genes (A) and the random gene set (B). Red lines in (A and B) represent mean expression of 1,000 random sets. (C and D) Natural log (ln) of fold-change in dcl3 plotted versus ln of fold-change in rdr2 for all genes on the ATH1 array (C) or cluster-proximal genes (D). R 2 is the square of the Pearson correlation and is the percent variation in rdr2 that is explained by variation in dcl3. Red lines are the best-fit lines. (E–J) Venn diagram analysis of genes significantly upregulated at least 1.5-fold (SAM false discovery rate = 0.01) in rdr2 or dcl3 and the cluster-proximal gene set (E), dcl1-7 (F), rdr6–15 (G), or all genes with a 24-nt small RNA within 200 nt of the 5′ end (H), within the gene (I), or within 200 nt of the 3′ end (J).

References

    1. Almeida R, Allshire RC. RNA silencing and genome regulation. Trends Cell Biol. 2005;15:251–258. - PubMed
    1. Tomari Y, Zamore PD. Perspective: Machines for RNAi. Genes Dev. 2005;19:517–529. - PubMed
    1. Meister G, Tuschl T. Mechanisms of gene silencing by double-stranded RNA. Nature. 2004;431:343–349. - PubMed
    1. Du T, Zamore PD. microPrimer: The biogenesis and function of microRNA. Development. 2005;132:4645–4652. - PubMed
    1. Brodersen P, Voinnet O. The diversity of RNA silencing pathways in plants. Trends Genet. 2006;22:268–280. - PubMed

Publication types