. 2007 Mar;5(3):e68.
doi: 10.1371/journal.pbio.0050068.

A novel role for the TIR domain in association with pathogen-derived elicitors

Affiliations

A novel role for the TIR domain in association with pathogen-derived elicitors

Tessa M Burch-Smith et al. PLoS Biol. 2007 Mar.

Erratum in

Abstract

Plant innate immunity is mediated by Resistance (R) proteins, which bear a striking resemblance to animal molecules of similar function. Tobacco N is a TIR-NB-LRR R gene that confers resistance to Tobacco mosaic virus, specifically the p50 helicase domain. An intriguing question is how plant R proteins recognize the presence of pathogen-derived Avirulence (Avr) elicitor proteins. We have used biochemical cell fraction and immunoprecipitation in addition to confocal fluorescence microscopy of living tissue to examine the association between N and p50. Surprisingly, both N and p50 are cytoplasmic and nuclear proteins, and N's nuclear localization is required for its function. We also demonstrate an in planta association between N and p50. Further, we show that N's TIR domain is critical for this association, and indeed, it alone can associate with p50. Our results differ from current models for plant innate immunity that propose detection is mediated solely through the LRR domains of these molecules. The data we present support an intricate process of pathogen elicitor recognition by R proteins involving multiple subcellular compartments and the formation of multiple protein complexes.


Conflict of interest statement

Competing interests. The authors have declared that no competing interests exist.

Figures

Figure 1
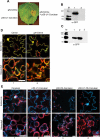
Figure 1. N and p50 Are Found in the Soluble Fraction of Protein Extracts
(A) gN-TAP or p50-U1-HA alone do not cause HR cell death in N. benthamiana plants that do not contain N (left), whereas co-expression causes death (right). (B) Western blot analysis was used to confirm expression of gN-TAP (lane 1). Lane 2 is an empty vector control. M is the size marker, and protein sizes are shown in kDa. (C) Western blot analysis was used to confirm expression of p50-U1-HA (lane 1) and p50-U1-Ob-HA (lane 2). Lane 3 is an empty vector control. M is the size marker, and protein sizes are shown in kDa. (D) Proteins extracts were centrifuged at 100,000×g to produce crude soluble (S100) and membrane (P100) fractions. Fractions were analyzed by Western blot analysis following separation by SDS-PAGE. gN-TAP is found in the soluble fraction in the absence (panel 1) and presence (panel 2) of TMV. PEPC is a cytoplasmic marker, and BiP is found in both the ER and cytoplasm. (E) p50-U1-HA (panel 1) and p50-U1-Ob-HA (panel 2) are both found in the soluble fraction.
Figure 2
Figure 2. N and p50-U1 Are Cytoplasmic and Nuclear
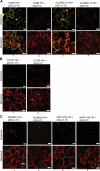
(A) gN-Citrine and p50-U1-Cerulean alone do not cause HR cell death on N. benthamiana plants that do not contain N (left), whereas co-expression causes death (right). (B) Expression of gN-Citrine (lane 1) is confirmed by detection with anti-GFP antibodies. Lane 2 is an empty vector control. M is the size marker, and protein sizes are shown in kDa. (C) Expression of p50-U1-Cerulean (lane 1) and p50-U1-Ob-Cerulean (lane 2) is confirmed by Western blot with anti-GFP antibodies. Lane 3 is empty vector control. M is the size marker, and protein sizes are shown in kDa. (D) Localization of gN-Citrine by fluorescence microcopy. gN-Citrine is present in the cytoplasm and nuclei of cells (column 2). Citrine only (column 1) is shown for comparison. Structures in red are chloroplasts. The 514-nm laser line of a 15-mW argon laser and the 543-nm laser line of a 5-mW helium neon laser with appropriate emission filters were used to image Citrine and chloroplast autofluorescence, respectively. Scale bar represents 20 μm. (E) Localization of p50-Cerulean. p50-U1-Cerulean (column 2) is found in the cytoplasm and nuclei of transfected cells. Cerulean alone is shown for comparison (column 1). p50-Ob-Cerulean from a non-eliciting strain of TMV is chloroplastic (column 3), but a p50-U1-Ob-Cerulean chimera shows the same localization as p50-U1-Cerulean (column 4). The 458-nm laser line of a 15-mW argon laser and the 543-nm laser line of a 5-mW helium neon laser with appropriate emission filters were used to image Cerulean and chloroplast autofluorescence, respectively. Scale bars represent 20 μm.
Figure 3
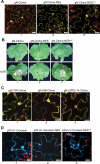
Figure 3. N's Nuclear Localization, but Not p50′s, Is Required for Function
(A) Subcellular localization of N with NES. gN-Citrine tagged with a NES is excluded from plant cell nuclei and is found only in the cytoplasm (column 2). gN-Citrine carrying a mutated NES accumulates in the nuclei of plant cells (column 3), and its distribution is similar to that of gN-Citrine (column 1). Citrine fluorescence was imaged with 514-nm laser line of a 15-mW argon laser. Scale bar represents 20 μm. (B) HR assay for function of nuclear N. gN-Citrine expressed alone does not cause HR (column 1, top), but causes HR in the presence of p50-U1 (column 1, bottom). Nuclear-excluded gN-Citrine-NES does not cause HR in the absence (column 2, top) or presence (column 2, bottom) of p50-U1. gN-Citrine-NESmut causes HR only in the presence of p50-U1 (column 3). (C) Defining N's domain required for nuclear localization. NΔTIR-Citrine (column 1), NΔNBS-Citrine (column 2), and NΔLRR2–14-Citrine (column 3) are cytoplasmic and nuclear. There are reduced levels of NΔLRR2–14-Citrine in the nucleus, but the visibility of the nucleolus confirms its presence (column 3). Scale bars represent 20 μm. (D) Subcellular localization of p50-U1 with NES. p50-U1-Ceruelan tagged with a NES is excluded from nuclei and is found only in the cytoplasm (column 2). p50-U1-Ceruelan-NESmut accumulates in nuclei (column 3), and its pattern of distribution is identical to that of p50-U1-Ceruelan (column 1). The 458-nm laser line of a 15-mW argon laser with appropriate emission filters was used to image Cerulean fluorescence. Scale bars represent 20 μm.
Figure 4
Figure 4. N Co-Immunoprecipitates with p50-U1, but Not with p50-U1-Ob
Protein extracts were prepared from N. benthamiana leaves co-expressing gN-TAP (top panel, lanes 1–3) and Cerulean alone (middle panel, lane 1), p50-U1-Cerulean (middle panel, lane 2), or p50-U1-Ob-Cerulean (middle panel, lane 3). Immuno-complexes were pulled down using anti-GFP antibodies. gN-TAP co-immunoprecipitated with p50-U1-Cerulean (bottom panel, lane 2), but not with Cerulean (bottom panel, lane 1) or the non-eliciting p50-U1-Ob-Cerulean (bottom panel, lane 3).
Figure 5
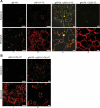
Figure 5. N and p50-U1 Associate In Vivo
(A) The BiFC assay was used to demonstrate the ability of N and p50-U1 to associate in living tissue. gN-YN (column 1) alone and p50-U1-YC (column 2) alone do not produce fluorescence in N. benthamiana tissue. Co-expression of gN-YN and p50-U1-YC produces Citrine fluorescence (column 3), demonstrating a close association between N and p50-U1. GUS-YC is used as control for the specificity of associations involving gN-YN (column 4). Citrine fluorescence was imaged with the 514-nm laser line of a 15-mW argon laser. Scale bar represents 20 μm. (B) p50-U1-Ob-YC expressed alone does not produce fluorescence (column 1). Co-expression of gN-YN and the non-eliciting p50-U1-Ob-YC does not produce Citrine fluorescence (column 2), indicating that they do not associate in vivo. Scale bar represents 20 μm.
Figure 6
Figure 6. p50-U1 Fails to Associate with N TIR Mutants
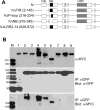
(A) N and deletion mutants used to determine the domain required for association with p50. Numbers in parentheses are deleted amino acid residues. Not drawn to scale. (B) Co-immunoprecipitation of gN-TAP and N-mutant-TAP proteins with p50-U1-Cerulean. Top panel shows input of N and its mutants, middle panel shows Cerulean-tagged proteins immunoprecipitated with anti-GFP antibodies, and the bottom panel shows the N and N-mutants co-immunoprecipitated. gN-TAP + Cerulean (lane 1); gN-TAP + p50-U1-Cerulean (lane 2); NΔTIR-TAP + p50-U1-Cerulean (lane 3); NΔP-loop-TAP + p50-U1-Cerulean (lane 4); NΔNB-TAP + p50-U1-Cerulean (lane 5); NΔLRR2–14-TAP + p50-U1-Cerulean (lane 6); N(D46H)TAP + p50-U1-Cerulean (lane 7); N(W141S)TAP + p50-U1-Cerulean (lane 8); and gN-TAP +p50-U1-Ob-Cerulean (lane 9). NΔTIR-TAP and the N-TIR point mutants, N(D46H)-TAP and N(W141S)-TAP, are not pulled down by p50-U1-Cerulean (bottom panel, lanes 3, 7, and 8). gN-TAP +p50-U1-Ob-Cerulean (lane 9) or Cerulean (lane 1) are negative controls. Lane M is the size marker, and protein size is in kDa.
Figure 7
Figure 7. The TIR Domain Is Critical for the Association of N and p50
(A) NΔNB-YN and NΔLRR-YN produce Citrine fluorescence when co-expressed with p50-U1-YC (columns 1 and 3). The specificity of the associations was confirmed by co-expression with GUS-YC (columns 2 and 4). (B) NΔTIR-YN and p50-U1-YC do not exhibit BiFC when co-expressed (column 1). NΔTIR-YN also does not produce fluorescence with GUS-YC (column 2). (C) TIR domain point mutants that disrupt N-mediated resistance also do not show BiFC when co-expressed with p50-U1-YC (columns 1 and 3). As expected, they also do not produce fluorescence when co-expressed with GUS-YC (columns 2 and 4). Scale bar represents 20 μm.
Figure 8
Figure 8. N's TIR Domain Is Sufficient for Association with p50-U1
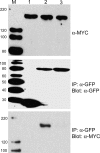
(A) Co-immunoprecipitation of gN-TIR-TAP and p50-U1-Cerulean. N's TIR domain was expressed under the control of N's endogenous 5′ and 3′ regulatory regions. Extracts from tissue co-expressing N(TIR)-TAP (top panel, lanes 1 and 2) and p50-U1-Cerulean (middle panel, lane 1) or p50-U1-Ob-Cerulean (middle panel, lane 2) were incubated with anti-GFP antibodies. Immunoprecipitated complexes were separated by SDS-PAGE and probed with anti-MYC antibodies. N(TIR)-TAP was pulled down with p50-U1-Cerulean (bottom panel, lane 1), but not with p50-U1-Ob-Cerulean (bottom panel, lane 2). Lane M is the size marker, and protein sizes are shown in kDa. (B) BiFC between N(TIR)-YN and p50-U1-YC. N(TIR)-YN exhibits BiFC with p50-U1-YC (column 1), but not with p50-U1-Ob-YC (column 2). The TIR domains of two related R proteins, BS4 and RPP5, were tested for their ability to associate in vivo with p50-U1-YC. BS4(TIR)-YC and RPP5(TIR)-YC were co-expressed with p50-U1-YC, but were unable to exhibit BiFC (columns 3 and 4, respectively). Scale bar represents 20 μm.
Figure 9
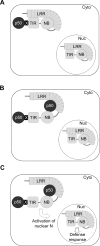
Figure 9. A Model for N Function
(A) The first step in recognition. In the cytoplasm (Cyto), p50 (black circle) associates with N through N's TIR domain. The association is bridged by other host factor(s) (X). This may result in conformational changes in N that disrupt interaction of the TIR-NB and LRR and allows oligomerization of N. There is a pool of nuclear N whose function during this time is unknown. Nuc, nucleus. (B) The second step in recognition. p50 then interacts directly with the NB and LRR domains, although it may maintain its association at the TIR domain. (C) The defense response initiation. Following recognition, nuclear N is activated by an unknown mechanism. This leads to signaling that culminates in a defense response.

References

    1. Chisholm ST, Coaker G, Day B, Staskawicz BJ. Host-microbe interactions: Shaping the evolution of the plant immune response. Cell. 2006;124:803–814. - PubMed
    1. Flor H. Current status of the gene-for-gene concept. Annu Rev Phytopathol. 1971;9:275–296.
    1. Martinon F, Tschopp J. NLRs join TLRs as innate sensors of pathogens. Trends Immunol. 2005;26:447–454. - PubMed
    1. Nurnberger T, Brunner F, Kemmerling B, Piater L. Innate immunity in plants and animals: Striking similarities and obvious differences. Immunol Rev. 2004;198:249–266. - PubMed
    1. van der Biezen EA, Jones JD. The NB-ARC domain: A novel signaling motif shared by plant resistance gene products and regulators of cell death in animals. Curr Biol. 1998;8:R226–R227. - PubMed

Publication types