Comparative Study
. 2007 Feb 13:8:48.
doi: 10.1186/1471-2164-8-48.

Characterization of relationships between transcriptional units and operon structures in Bacillus subtilis and Escherichia coli

Affiliations
Comparative Study

Characterization of relationships between transcriptional units and operon structures in Bacillus subtilis and Escherichia coli

Shujiro Okuda et al. BMC Genomics. .

Abstract

Background: Operon structures play an important role in transcriptional regulation in prokaryotes. However, there have been fewer studies on complicated operon structures in which the transcriptional units vary with changing environmental conditions. Information about such complicated operons is helpful for predicting and analyzing operon structures, as well as understanding gene functions and transcriptional regulation.

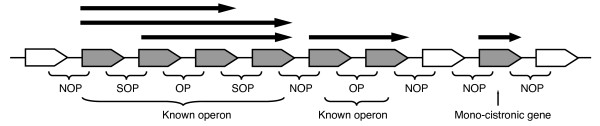
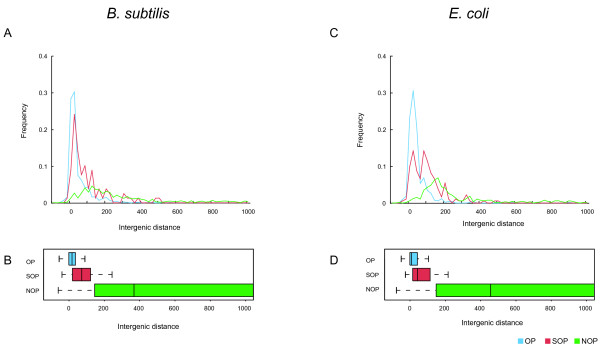
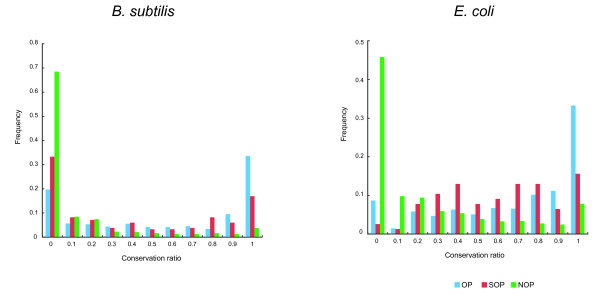
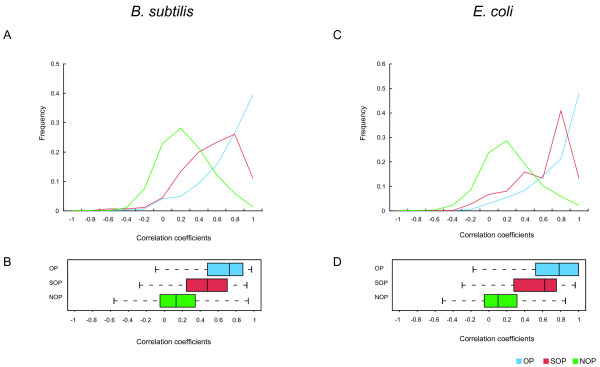
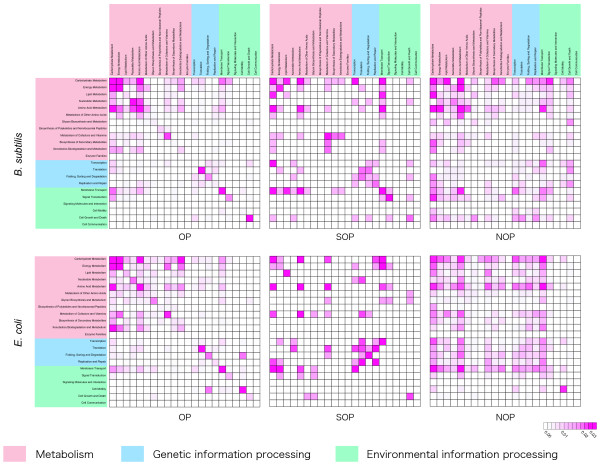
Results: We systematically analyzed the experimentally verified transcriptional units (TUs) in Bacillus subtilis and Escherichia coli obtained from ODB and RegulonDB. To understand the relationships between TUs and operons, we defined a new classification system for adjacent gene pairs, divided into three groups according to the level of gene co-regulation: operon pairs (OP) belong to the same TU, sub-operon pairs (SOP) that are at the transcriptional boundaries within an operon, and non-operon pairs (NOP) belonging to different operons. Consequently, we found that the levels of gene co-regulation was correlated to intergenic distances and gene expression levels. Additional analysis revealed that they were also correlated to the levels of conservation across about 200 prokaryotic genomes. Most interestingly, we found that functional associations in SOPs were more observed in the environmental and genetic information processes.

Conclusion: Complicated operon structures were correlated with genome organization and gene expression profiles. Such intricately regulated operons allow functional differences depending on environmental conditions. These regulatory mechanisms are helpful in accommodating the variety of changes that happen around the cell. In addition, such differences may play an important role in the evolution of gene order across genomes.


Figures

Figure 1
Figure 1
The schematic model of operon structures. Arrows indicate the regions transcribed as known TUs. Gray boxes indicate genes in a known operon and open boxes indicate the flanking genes. OP indicates a gene pair in a TU and both genes belong to the same TUs. SOP indicates a gene pair where both genes belong to the same TU and either one of the genes also belongs to a different TU. NOP indicates a gene pair where the genes belong to completely different TUs or, one gene belongs to a known TU and another has not been assigned to any known TUs yet.
Figure 2
Figure 2
Distributions of frequency of intergenic distances between adjacent genes. The upper figures are the distributions of intergenic distances (bp) between adjacent genes at 20 bp intervals in B. subtilis (A) and in E. coli (C), and the bottom figures are their box plots (B and D). The leftmost, rightmost and middle vertical lines of the boxes represent the first and third quartiles and median value, respectively. The intergenic distances more than 1000 bps are not shown. Blue, red and green lines indicate OPs, SOPs and NOPs, respectively.
Figure 3
Figure 3
Conservation of adajcent gene pairs across genomes. The left figure indicates the conservation ratio based on the gene pairs from B. subtilis, and the right figure is from E. coli. The ratios of adjacently conserved gene pairs for OPs, SOPs and NOPs are shown in blue, red and green, respectively.
Figure 4
Figure 4
Distributions of frequency of correlation coefficients of gene expression profiles between adjacent gene pairs. The upper figures are the distribution of correlation coefficients (A and C) and the bottom figures are their box plots (B and D). Blue, red and green lines indicate OPs, SOPs and NOPs, respectively.
Figure 5
Figure 5
Functional associations between adjacent gene pairs. The upper figures indicate the functional associations in B. subtilis and the lower represent E. coli. The proportion of gene pairs that have the functional categories shown on the x and y axis is represented by a box with red color. When the color is deeper, it indicates the proportion is increasing.
Figure 6
Figure 6
Co-expression profile of operons: the schematic model of the operon diversity and its examples. (A) Schematic model of a diverse operon. In this model, we assume that there is a longer TU and a shorter TU. Arrows indicate the region transcribed as a TU. Open boxes to the side and above the grid indicate genes. Each box in the grid indicates the level of correlation of gene expression as colors from blue to red correspond to the correlation coefficients. The gene pairs without the TU boundary should show strong correlation with vivid red color. On the other hand, gene pairs across the boundary should show a slightly weaker correlation with orange color. (B) The sigB operon. There are two promoters in the sigB operon. The first one is located in the upstream of the first gene of the operon, and second one is located in between fourth and fifth genes. Therefore, two different transcripts cause this pattern. (rsbV in this operon was not measured in the microarray experiments, so the region of this gene is not colored.) (C) The clpC operon. The transcription of this operon is basically promoted by sigma B, while the last two genes (sms and yacK) were reported to be also transcribed by sigma M.

References

    1. Ogata H, Fujibuchi W, Goto S, Kanehisa M. A heuristic graph comparison algorithm and its application to detect functionally related enzyme clusters. Nucleic Acids Res. 2000;28:4021–4028. doi: 10.1093/nar/28.20.4021. - DOI - PMC - PubMed
    1. Overbeek R, Fonstein M, D'Souza M, Pusch GD, Maltsev N. The use of gene clusters to infer functional coupling. Proc Natl Acad Sci USA. 1999;96:2896–2901. doi: 10.1073/pnas.96.6.2896. - DOI - PMC - PubMed
    1. Zheng Y, Szustakowski JD, Fortnow L, Roberts RJ, Kasif S. Computational identification of operons in microbial genomes. Genome Res. 2002;12:1221–1230. doi: 10.1101/gr.200601. - DOI - PMC - PubMed
    1. Yada T, Nakao M, Totoki Y, Nakai K. Modeling and predicting transcriptional units of Escherichia coli genes using hidden Markov models. Bioinformatics. 1999;15:987–993. doi: 10.1093/bioinformatics/15.12.987. - DOI - PubMed
    1. Craven M, Page D, Shavlik J, Bockhorst J, Glasner J. A probabilistic learning approach to whole-genome operon prediction. Proc Int Conf Intell Syst Mol Biol. 2000;8:116–127. - PubMed

Publication types