. 2007 Apr 20;282(16):12176-85.
doi: 10.1074/jbc.M609435200. Epub 2007 Feb 12.

Relocalization of STIM1 for activation of store-operated Ca(2+) entry is determined by the depletion of subplasma membrane endoplasmic reticulum Ca(2+) store

Affiliations

Relocalization of STIM1 for activation of store-operated Ca(2+) entry is determined by the depletion of subplasma membrane endoplasmic reticulum Ca(2+) store

Hwei Ling Ong et al. J Biol Chem. .

Abstract

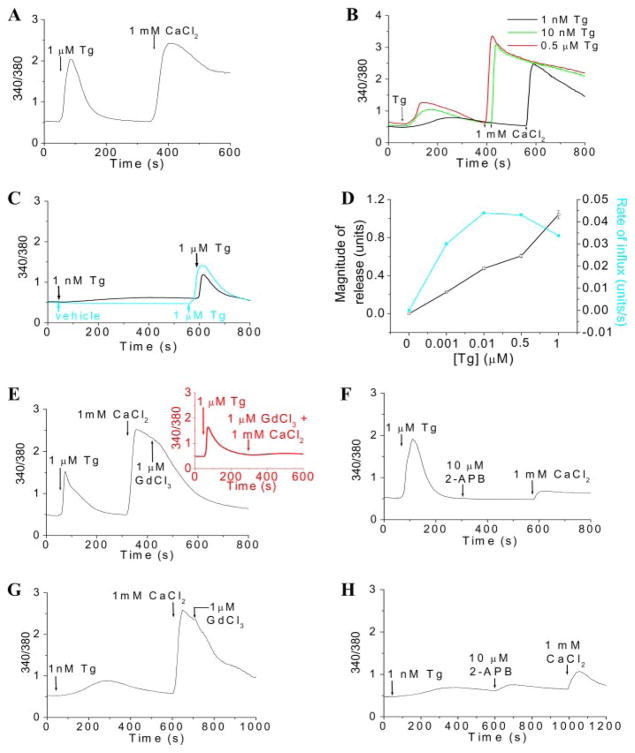
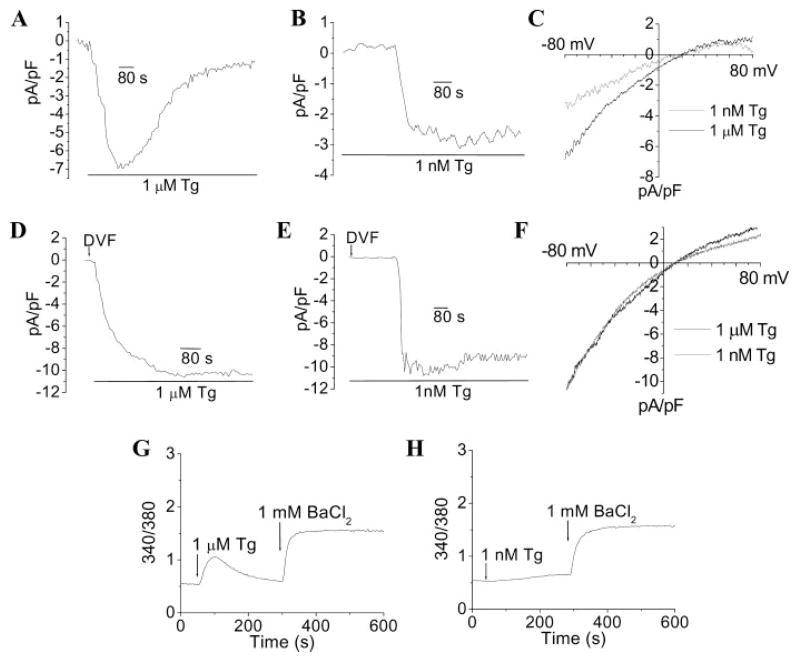
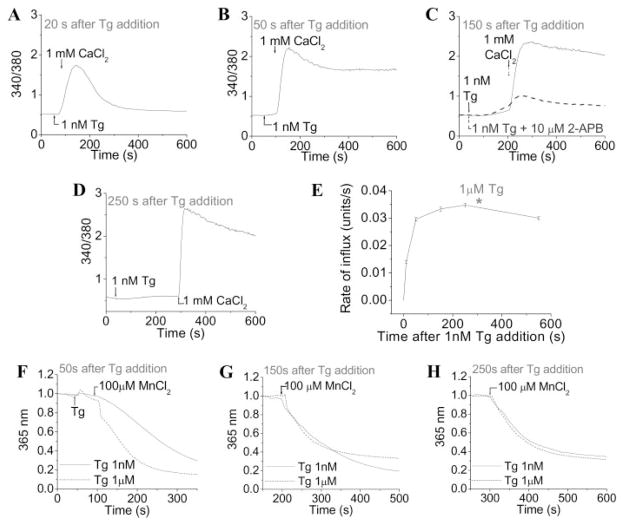
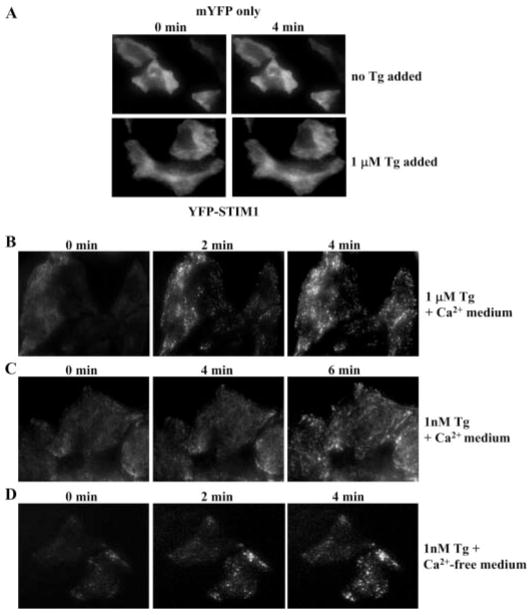
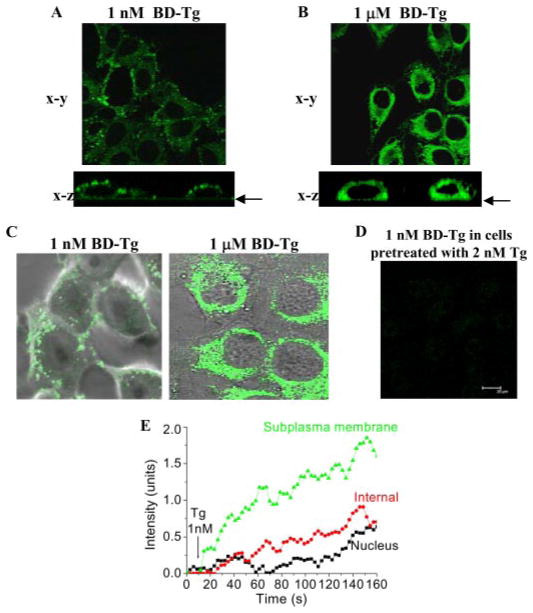
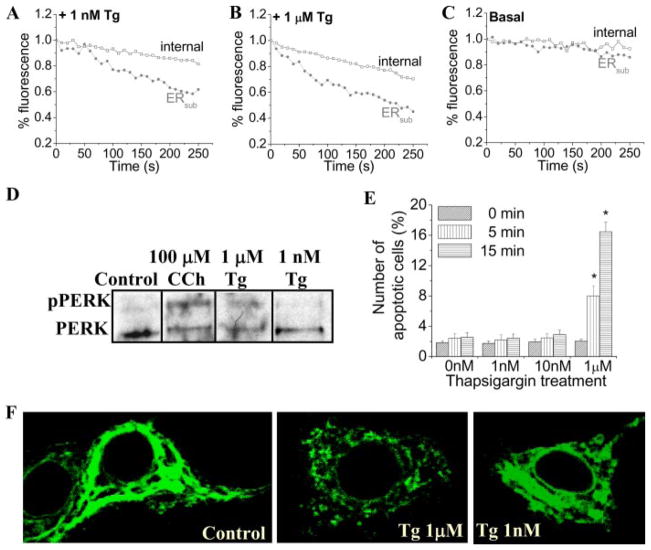
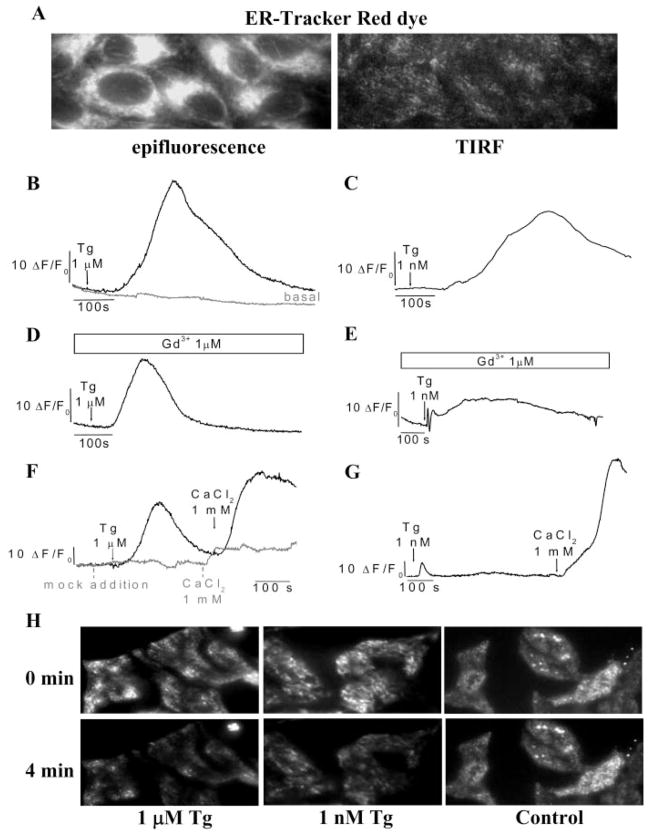
STIM1 (stromal interacting molecule 1), an endoplasmic reticulum (ER) protein that controls store-operated Ca(2+) entry (SOCE), redistributes into punctae at the cell periphery after store depletion. This redistribution is suggested to have a causal role in activation of SOCE. However, whether peripheral STIM1 punctae that are involved in regulation of SOCE are determined by depletion of peripheral or more internal ER has not yet been demonstrated. Here we show that Ca(2+) depletion in subplasma membrane ER is sufficient for peripheral redistribution of STIM1 and activation of SOCE. 1 microM thapsigargin (Tg) induced substantial depletion of intracellular Ca(2+) stores and rapidly activated SOCE. In comparison, 1 nM Tg induced slower, about 60-70% less Ca(2+) depletion but similar SOCE. SOCE was confirmed by measuring I(SOC) in addition to Ca(2+), Mn(2+), and Ba(2+) entry. Importantly, 1 nM Tg caused redistribution of STIM1 only in the ER-plasma membrane junction, whereas 1 microM Tg caused a relatively global relocalization of STIM1 in the cell. During the time taken for STIM1 relocalization and SOCE activation, 1 nM Bodipy-fluorescein Tg primarily labeled the subplasma membrane region, whereas 1 microM Tg labeled the entire cell. The localization of Tg in the subplasma membrane region was associated with depletion of ER in this region and activation of SOCE. Together, these data suggest that peripheral STIM1 relocalization that is causal in regulation of SOCE is determined by the status of [Ca(2+)] in the ER in close proximity to the plasma membrane. Thus, the mechanism involved in regulation of SOCE is contained within the ER-plasma membrane junctional region.


Figures

FIGURE 1
FIGURE 1. Activation of SOCE by incomplete depletion of ER Ca2+stores
A and B, Tg-induced intracellular Ca2+release and Ca2+entry in HSG cells. The various [Tg] used for activation of SOCE are indicated in the figure. C, Ca2+release induced by 1 μM Tg in control cells (blue trace) and in cells previously treated with 1 nM Tg (black trace), indicating the extent of depletion of ER by 1 nM Tg. D, dose-response curve showing the effect of [Tg] on Ca2+release (units; squares) and the rate of Ca2+influx (units/s; circles). Data were plotted as mean ± S.E. from three or four separate experiments and expressed in 340/380 fluorescence ratio units; error bars were within the size of the symbols. Ca2+ influxes induced by 1 μM and 1 nM Tg were blocked by 1 μM GdCl3 (E and G, respectively) and 10 μM 2-APB (F and H, respectively). A trace showing the inhibition of Ca2+influx induced by 1 μM Tg by 1 μM GdCl3 added before 1 mM CaCl2 is shown as an inset (similar results were seen with 1 nM Tg; data not shown) in E. [Ca2+]i was measured in Fura-2-loaded cells and is expressed as 340/380 ratio. Each analog plot showing Ca2+ release and Ca2+ entry is representative of at least four experiments, each trace showing the average from at least 50 cells.
FIGURE 2
FIGURE 2. Activation of ISOC and Ba2+ influx by thapsigargin
Shown is activation of ISOC by high (A) and low [Tg] (B) in Ca2+- and Mg2+-containing external medium (currents recorded at −80 mV are plotted). I-V relationships of the maximum currents shown in A and B are presented in C. Shown is activation of ISOC by high (D) and low [Tg] (E) in DVF medium (currents recorded at −80 mV are plotted). I-V relationships of the maximum currents in D and E are shown in F. These data represent results obtained with a minimum of 7–10 cells under each condition, with each trace showing the plot obtained with a single representative cell. Other details are provided under “Experimental Procedures.” Shown is 1 μM (G) and 1 nM Tg (H)-induced Ba2+influx. Cells were stimulated with Tg in Ca2+-free medium, and 1 mM BaCl2 was added where indicated. Basal Ba2+ entry, in unstimulated cells incubated in Ca2+-free medium was minimal (data not shown).
FIGURE 3
FIGURE 3. Temporal characteristics of SOCE activation
Cells were stimulated with 1 nM Tg in Ca2+-free medium. 1 mM CaCl2 was added at 20 (A), 50 (B), 150 (C), and 250 s (D) after the Tg addition. E, time course of SOCE activation upon Ca2+ addition after 1 nM Tg (rate of Ca2+ influx (units/s) versus time (s) after 1 nM Tg addition). The asterisk shows the rate of maximal Ca2+ influx (units/s) induced by 1 μM Tg with 1 mM CaCl2 added 300 s after the Tg addition. Data are plotted as mean ± S.E. (n = 3). Mn2+ influx was induced by 1 μM (dotted line) and 1 nM Tg (solid line). Cells were stimulated with Tg in Ca2+-free medium, and 100 μM MnCl2 was added 50 (F), 150 (G), and 250 s (H) after the addition of Tg. Relative fluorescence at 365 nm is shown (these traces represent average fluorescence changes from more than 70 cells. Similar results were obtained in four separate experiments).
FIGURE 4
FIGURE 4. Redistribution of YFP-STIM1 to the subplasma membrane region following Tg stimulation
A, distribution of mYFP, measured using TIRFM in control and Tg-treated cells. B and C, redistribution of YFP-STIM1 following stimulation with 1 μM and 1 nM Tg, respectively, in Ca2+-containing medium. D, redistribution of YFP-STIM1 following stimulation with 1 nM Tg in Ca2+-free medium. The time point at which each image was taken is noted in the figure.
FIGURE 5
FIGURE 5. Localization of Tg during activation of SOCE
A and B, labeling of HSG cells with 1 nM and 1 μM BD-Tg detected by confocal microscopy. The images shown were taken 3 min after the addition of BD-Tg and displayed along the x-y (top) and x–z (bottom) axes. The arrow shows the bottom of the dish (C). Overlays of BD-Tg labeled cells and the differential interference contrast images of the same field. D, dampening of the BD-Tg signal when 1 nM BD-Tg was added following preincubation of cells with 2 nM unlabeled Tg. E, time course of labeling the subplasma membrane, internal, and nuclear regions with 1 nM BD-Tg. Quantification was done as described under “Experimental Procedures” using specific regions of interest in the areas of the cell indicated. Similar data were obtained from five separate experiments.
FIGURE 6
FIGURE 6. Tg-stimulated depletion of ER Ca2+
[Ca2+] in internal (squares) and subplasma membrane ER (ERsub; circles) calcium stores in cells treated with 1 nM (A) or 1 μM Tg (B) and control cells (C) was measured using imaging of Mag-Fluo4 fluorescence. Confocal microscopy (details are given under “Experimental Procedures”) was used to determine fluorescence changes. Fluorescence was determined in demarcated areas in the plasma membrane and internal regions (areas not shown). Traces shown are averages from at least 6 – 8 cells and represent similar data obtained from three separate experiments. D, detection of phosphorylated PERK (pPERK) in lysates of HSG cells treated with 100 μM CCh, 1 μM Tg, and 1 nM Tg by Western blotting using phospho-PERK antibody (1:1000 dilution). E, the percentage of apoptotic cells detected using the Vybrant staining assay in control HSG cells and cells treated with 1 nM, 10 nM, and 1 μM thapsigargin for 0, 5, and 15 min. Data are plotted as mean ± S.E., where an asterisk indicates p < 0.05. F, distribution of STIM1 in control HSG cells and following stimulation with 1 μM and 1 nM Tg. STIM1 was detected using the mouse anti-STIM1 antibody (1:100 dilution) and the fluorescein isothiocyanate-conjugated anti-mouse secondary antibody (1:100 dilution).
FIGURE 7
FIGURE 7. Tg-stimulated [Ca2+] changes in the subplasma membrane region
A, localization of the ER network within the subplasma membrane region using the ER-Tracker Red dye; the left shows an epifluorescence image, and the right shows a TIRF image. TIRFM was used to monitor [Ca2+]i with Fluo-4 (B–G) and [Ca2+] in the ER with Mag-Fluo4 (H) fluorescence in the subplasma membrane region of HSG cells (details under “Experimental Procedures”). Each analog plot showing Ca2+release and Ca2+entry is representative of at least two experiments, with each trace showing the average for at least 20 cells. B–E, cells were stimulated with Tg in Ca2+-containing medium, with or without 1 μM GdCl3 (Gd3+). Basal Ca2+ influx is as shown in B. F and G, cells were initially stimulated with thapsigargin (Tg) in Ca2+-free medium, followed by the readdition of 1 mM CaCl2 (fluorescence increase in each case was similar in the presence of Gd3+or in Ca2+-free medium; note that the scales in F and G are different from those in B–E). Basal Ca2+influx is shown in F. H, cells were stimulated with Tg in Ca2+-free medium. Images at 0 and 4 min after the Tg addition are as shown. For control cells, buffer was added instead of Tg.

Similar articles

Cited by

References

    1. Liu X, Ambudkar IS. J Biol Chem. 2001;276:29891–29898. - PubMed
    1. Liu X, O’Connell A, Ambudkar IS. J Biol Chem. 1998;273:33295–33304. - PubMed
    1. Parekh AB. J Physiol (Lond) 2003;547:333–348. - PMC - PubMed
    1. Ambudkar IS. Sci STKE. 2004;2004:pe32. - PubMed
    1. Berridge M. Sci STKE. 2004;2004:pe33. - PubMed