Comparative Study
. 2007:3:79.
doi: 10.1038/msb4100117. Epub 2007 Feb 13.

Comparative proteomic and transcriptomic profiling of the fission yeast Schizosaccharomyces pombe

Affiliations
Comparative Study

Comparative proteomic and transcriptomic profiling of the fission yeast Schizosaccharomyces pombe

Michael W Schmidt et al. Mol Syst Biol. 2007.

Abstract

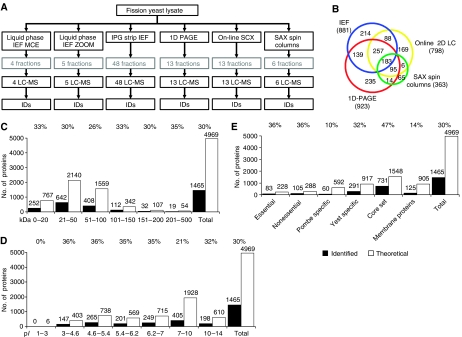
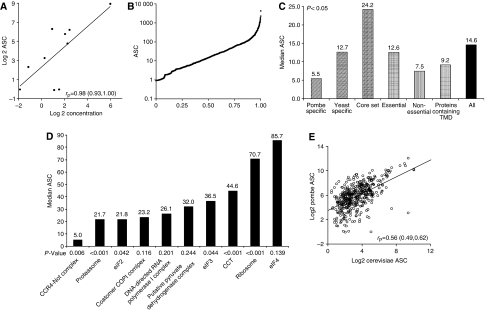
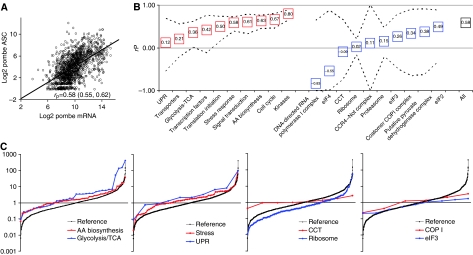
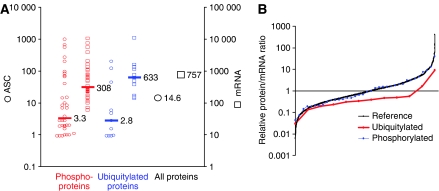
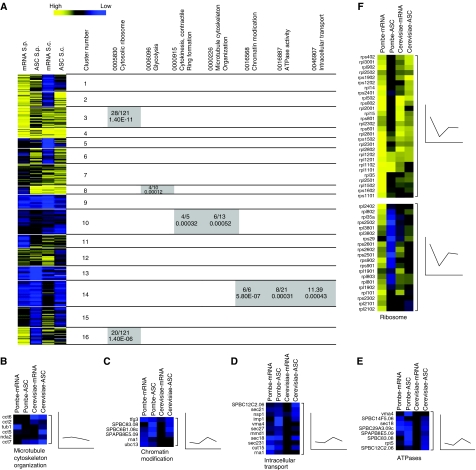
The fission yeast Schizosaccharomyces pombe is a widely used model organism to study basic mechanisms of eukaryotic biology, but unlike other model organisms, its proteome remains largely uncharacterized. Using a shotgun proteomics approach based on multidimensional prefractionation and tandem mass spectrometry, we have detected approximately 30% of the theoretical fission yeast proteome. Applying statistical modelling to normalize spectral counts to the number of predicted tryptic peptides, we have performed label-free quantification of 1465 proteins. The fission yeast protein data showed considerable correlations with mRNA levels and with the abundance of orthologous proteins in budding yeast. Functional pathway analysis indicated that the mRNA-protein correlation is strong for proteins involved in signalling and metabolic processes, but increasingly discordant for components of protein complexes, which clustered in groups with similar mRNA-protein ratios. Self-organizing map clustering of large-scale protein and mRNA data from fission and budding yeast revealed coordinate but not always concordant expression of components of functional pathways and protein complexes. This finding reaffirms at the protein level the considerable divergence in gene expression patterns of the two model organisms that was noticed in previous transcriptomic studies.


Figures

Figure 1
Figure 1
Analysis of the S. pombe proteome by multidimensional prefractionation and LC ESI MS/MS. (A) Flow chart of sample prefractionation. IEF=isoelectric focusing; ZOOM, MCE (multicompartment electrolizer)=liquid-phase IEF devices, IPG=immobilized pH gradient strips, SAX=strong anion exchange, LC-MS=liquid chromatography and mass spectrometry. (B) Summary of the number of proteins identified with each prefractionation method. The overlap between fractions is indicated. (C, D) Molecular weight and pI distribution of the identified proteins compared to the theoretical proteome. (E) Fractions of proteins identified that belong to the indicated categories.
Figure 2
Figure 2
Label-free relative quantification of S. pombe proteins. (A) Correlation of published absolute quantitation data for several cytokinesis proteins with their corresponding ASCs. (B) ASCs for each of the 1465 identified proteins plotted on a log scale. (C) Median ASCs for proteins belonging to the indicated categories. All numbers were statistically different at P<0.05 (TMD=transmembrane domain). (D) Median ASCs for subunits of the indicated protein complexes. For protein complexes with few subunits, P-values are not always <0.05 owing to some outliers (see Supplementary Data File 4). (E) Correlation between the Pombe-ASC and the Cerevisiae-ASC data sets.
Figure 3
Figure 3
Correlation of protein and mRNA levels in fission yeast. (A) Scatter plot representing the relationship between mRNA and protein (Pombe-ASC). The Pearson correlation coefficient is indicated. (B) Protein–mRNA correlation coefficients for proteins belonging to the indicated pathways, protein families, and complexes. Dashed lines indicate 95% confidence intervals (AA=amino acid, UPR=unfolded protein response, TCA=tricarboxylic acid cycle). (C) Protein–mRNA ratios for individual members of the indicated pathways, protein families, or complexes. The data are displayed relatively to median centered ratios of the entire data set of 1381 mRNA–protein pairs (black graphs).
Figure 4
Figure 4
Protein and mRNA ratios of post-translationally modified proteins. (A) mRNA levels and ASCs for 40 phosphorylated and 11 ubiquitylated proteins as compared to the entire data set. Medians are indicated by the vertical bars. (B) Individual protein–mRNA ratios for phosphorylated and ubiquitylated proteins relative to median centered ratios of the entire data set.
Figure 5
Figure 5
Comparison of proteome and transcriptome data from S. pombe and S. cerevisiae. (A) Self-organizing map cluster analysis of the fission and budding yeast mRNA and ASC protein data sets. The table on the right shows GO terms overrepresented in the various clusters and the P-values of enrichment. Also indicated is the number of proteins with a particular GO attribute enriched in each cluster over the total number with this attribute present in the entire data set. The names of the genes and proteins in the individual clusters are listed in Supplementary Data File 6. (B–E) Detailed view of subclusters containing (B) microtubule cytoskeleton organization (GO: 0000226), (C) chromatin modification components (GO: 0016568), (D) components involved in intracellular transport (GO: 0046907), (E) ATPases (GO: 0016887), and (F) ribosomal proteins (GO: 0005830). The graphs next to the heat maps indicate the mean variations in signal intensities.

Similar articles

Cited by

References

    1. Anderson NL, Matheson AD, Steiner S (2000) Proteomics: applications in basic and applied biology. Curr Opin Biotechnol 11: 408–412 - PubMed
    1. Bachand F, Lackner DH, Bahler J, Silver PA (2006) Autoregulation of ribosome biosynthesis by a translational response in fission yeast. Mol Cell Biol 26: 1731–1742 - PMC - PubMed
    1. Bakhtiar R, Tse FL (2000) Biological mass spectrometry: a primer. Mutagenesis 15: 415–430 - PubMed
    1. Berriz GF, King OD, Bryant B, Sander C, Roth FP (2003) Characterizing gene sets with FuncAssociate. Bioinformatics 19: 2502–2504 - PubMed
    1. Chen D, Toone WM, Mata J, Lyne R, Burns G, Kivinen K, Brazma A, Jones N, Bahler J (2003) Global transcriptional responses of fission yeast to environmental stress. Mol Biol Cell 14: 214–229 - PMC - PubMed

Publication types

MeSH terms