. 2007:3:83.
doi: 10.1038/msb4100124. Epub 2007 Feb 13.

Computational analysis of the synergy among multiple interacting genes

Affiliations

Computational analysis of the synergy among multiple interacting genes

Dimitris Anastassiou. Mol Syst Biol. 2007.

Abstract

Diseases such as cancer are often related to collaborative effects involving interactions of multiple genes within complex pathways, or to combinations of multiple SNPs. To understand the structure of such mechanisms, it is helpful to analyze genes in terms of the purely cooperative, as opposed to independent, nature of their contributions towards a phenotype. Here, we present an information-theoretic analysis that provides a quantitative measure of the multivariate synergy and decomposes sets of genes into submodules each of which contains synergistically interacting genes. When the resulting computational tools are used for the analysis of gene expression or SNP data, this systems-based methodology provides insight into the biological mechanisms responsible for disease.


Figures

Figure 1
Figure 1
Venn diagrams indicating the mutual information common to multiple variables. (A) Mutual information common to two variables. Arrows stemming from the perimeter of a circle refer to the area inside the whole circle. Arrows stemming from the interior of a region refer to the area of that region. The mutual information I(X;Y) is defined by the intersection of the two sets, whereas the joint entropy H(X,Y)—not shown—is defined by the union of the two sets. (B) Mutual information common to three variables. The mutual information I(X;Y;Z) is defined by the intersection of the three sets. The bivariate synergy of any two of the variables with respect to the third is equal to the opposite of the mutual information common to the three variables and therefore positive synergy cannot be shown in a Venn diagram.
Figure 2
Figure 2
Examples of numerical evaluation of mutual information and synergy. In both cases, they should be seen as illustrations of the concept and not as representative of actual biological examples, in which many samples are needed for meaningful modeling. Black squares indicate a gene being ‘on' and white squares indicate a gene being ‘off.' (A) Evaluation of mutual information between a set of five genes and cancer from four normal and four cancerous samples. (B) Evaluation of the synergy between two genes with respect to cancer, derived from four normal and four cancerous samples. Two extreme cases are shown, the first with maximum synergy +1, and the second with minimum synergy −1 (redundancy).
Figure 3
Figure 3
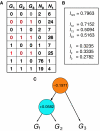
From the ‘state-count table' to the ‘tree of synergy.' (A) An example of a state-count resulting from hypothetical microarray measurements of three genes G1, G2, G3 in both the presence and absence of a particular cancer C. N0 and N1 are the counts of each state in the absence and presence of cancer, respectively. (B) The amounts of mutual information between each subset of the set of three genes and the presence of cancer, with simplified notation (see text). (C) The tree of synergy resulting from these sets making repeated use of the formula defining multivariate synergy. This decomposition separates the full set into two redundant subsets, one of which is the synergistic pair of genes G1, G2, consistent with the assumptions under which the state-count table was simulated.

References

    1. Boser BE, Guyon IM, Vapnik VN (1992) A training algorithm for optimal margin classifiers. In 5th Annual ACM Workshop on COLT, Haussler D (ed), pp 144–152. Pittsburgh, PA, USA: ACM Press
    1. Brenner N, Strong S, Koberle R, Bialek W, de Ruyter van Steveninck R (2000) Synergy in a neural code. Neural Comput 12: 1531–1552 - PubMed
    1. Chechik G, Globerson A, Anderson M, Young E, Nelken I, Tishby N (2002) Group redundancy measures reveal redundancy reduction in the auditory pathway. In Advances in Neural Information Processing Systems, Dietterich TG, Becker S, Ghahramani Z (eds), pp 173–180. Cambridge, MA: MIT Press
    1. Cover T, Thomas J (2006) Elements of Information Theory. New York, NY, USA: Wiley Interscience
    1. Eisen MB, Spellman PT, Brown PO, Botstein D (1998) Cluster analysis and display of genome-wide expression patterns. Proc Natl Acad Sci USA 95: 14863–14868 - PMC - PubMed

MeSH terms