

Maximum likelihood estimation of the negative binomial dispersion parameter for highly overdispersed data, with applications to infectious diseases
- PMID: 17299582
- PMCID: PMC1791715
- DOI: 10.1371/journal.pone.0000180
Maximum likelihood estimation of the negative binomial dispersion parameter for highly overdispersed data, with applications to infectious diseases
Abstract
Background: The negative binomial distribution is used commonly throughout biology as a model for overdispersed count data, with attention focused on the negative binomial dispersion parameter, k. A substantial literature exists on the estimation of k, but most attention has focused on datasets that are not highly overdispersed (i.e., those with k>or=1), and the accuracy of confidence intervals estimated for k is typically not explored.
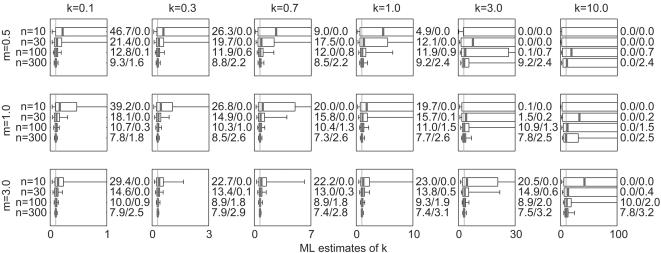
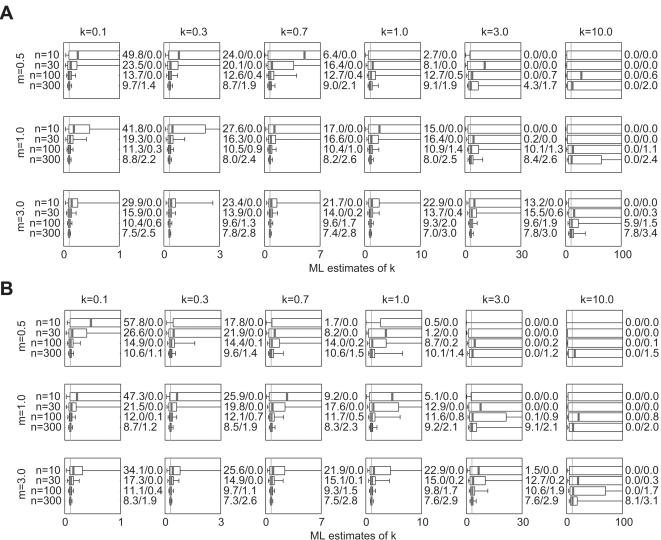
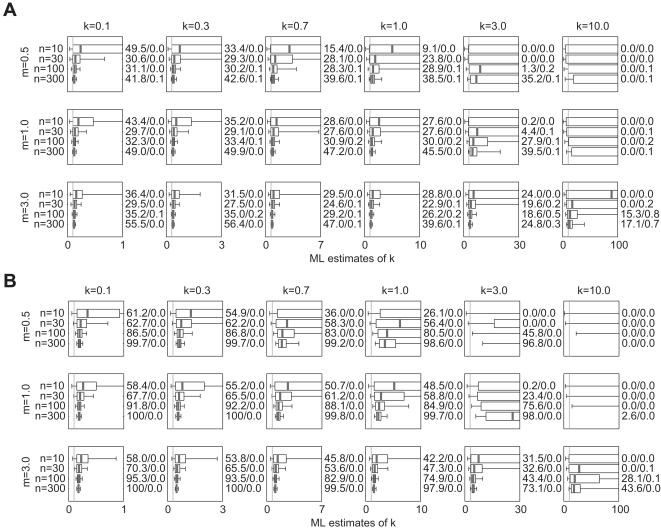
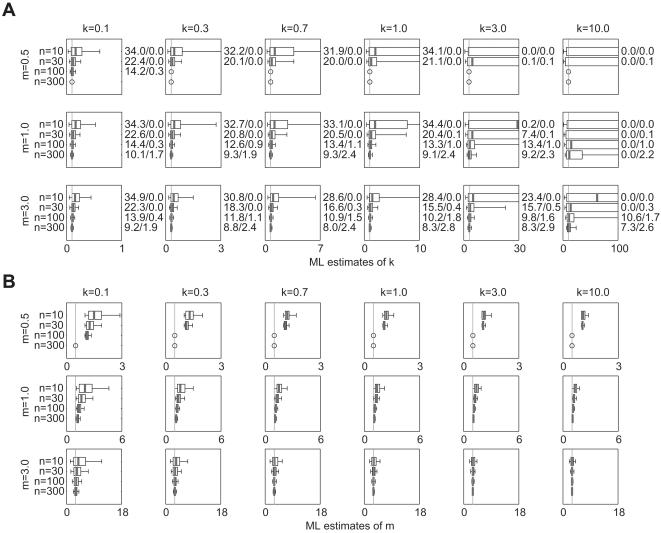
Methodology: This article presents a simulation study exploring the bias, precision, and confidence interval coverage of maximum-likelihood estimates of k from highly overdispersed distributions. In addition to exploring small-sample bias on negative binomial estimates, the study addresses estimation from datasets influenced by two types of event under-counting, and from disease transmission data subject to selection bias for successful outbreaks.
Conclusions: Results show that maximum likelihood estimates of k can be biased upward by small sample size or under-reporting of zero-class events, but are not biased downward by any of the factors considered. Confidence intervals estimated from the asymptotic sampling variance tend to exhibit coverage below the nominal level, with overestimates of k comprising the great majority of coverage errors. Estimation from outbreak datasets does not increase the bias of k estimates, but can add significant upward bias to estimates of the mean. Because k varies inversely with the degree of overdispersion, these findings show that overestimation of the degree of overdispersion is very rare for these datasets.
Conflict of interest statement
Figures
References
-
- Bliss CI, Fisher RA. Fitting the negative binomial distribution to biological data - note on the efficient fitting of the negative binomial. Biometrics. 1953;9:176–200.
-
- Pielou EC. Mathematical Ecology. New York: Wiley.; 1977.
-
- White GC, Bennetts RE. Analysis of frequency count data using the negative binomial distribution. Ecology. 1996;77:2549–2557.
-
- Shaw DJ, Grenfell BT, Dobson AP. Patterns of macroparasite aggregation in wildlife host populations. Parasitology. 1998;117:597–610. - PubMed
-
- Walther BA, Morand S. Comparative performance of species richness estimation methods. Parasitology. 1998;116:395–405. - PubMed
