. 2007 Feb 14;2(2):e207.
doi: 10.1371/journal.pone.0000207.

LoCoH: nonparameteric kernel methods for constructing home ranges and utilization distributions

Affiliations

LoCoH: nonparameteric kernel methods for constructing home ranges and utilization distributions

Wayne M Getz et al. PLoS One. .

Abstract

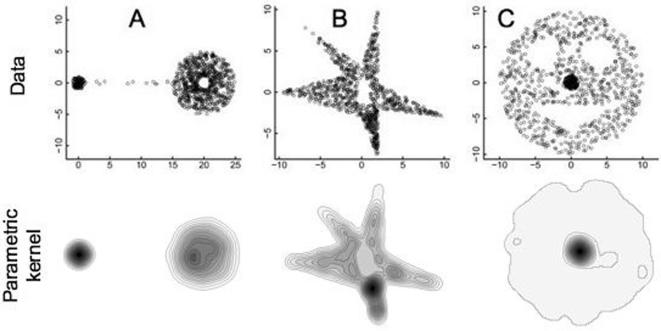
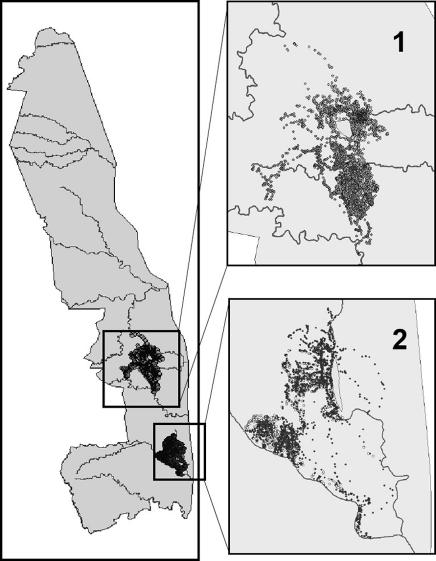
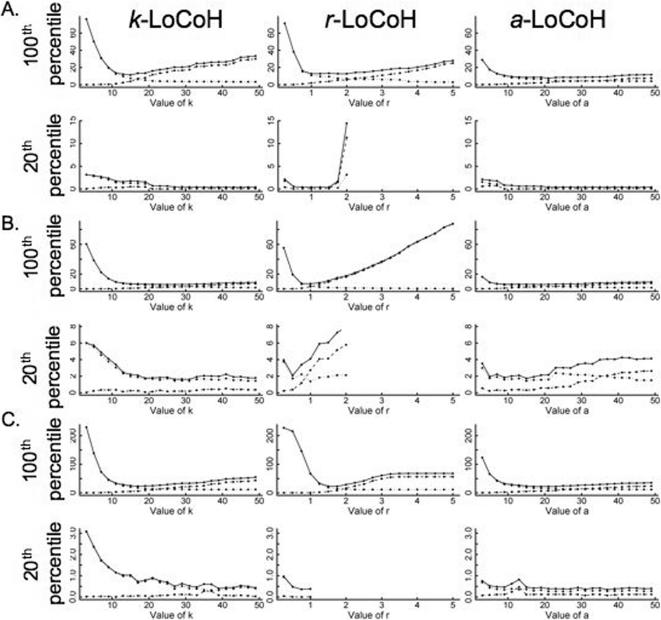
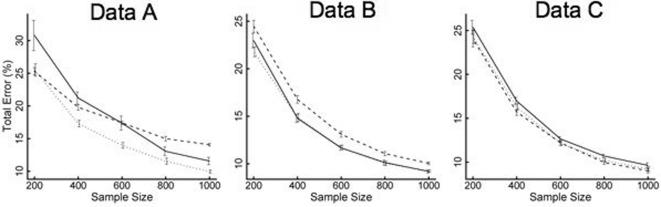
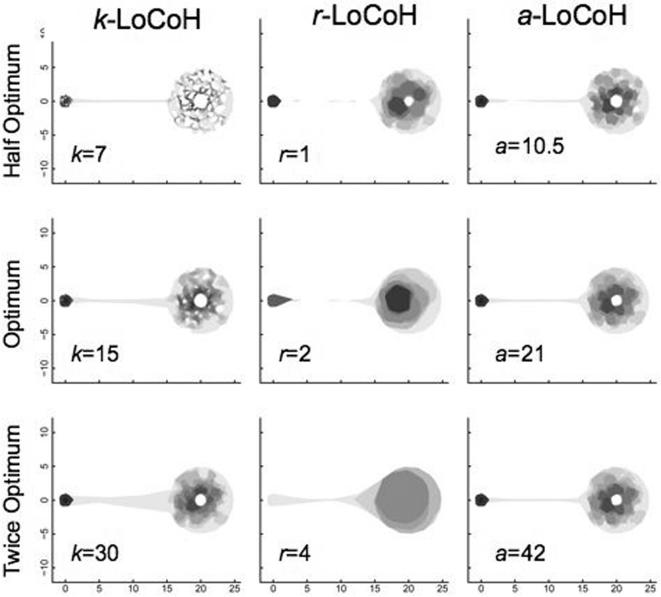
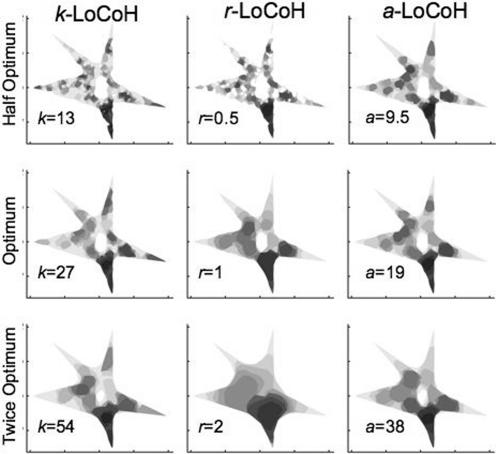
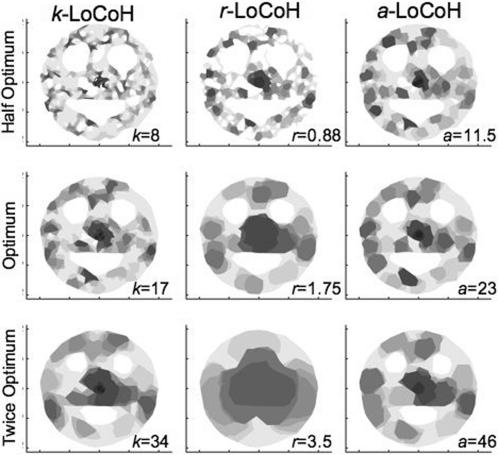
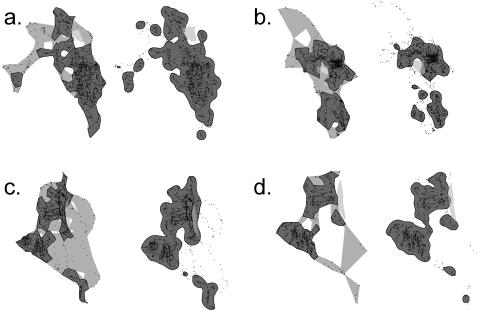
Parametric kernel methods currently dominate the literature regarding the construction of animal home ranges (HRs) and utilization distributions (UDs). These methods frequently fail to capture the kinds of hard boundaries common to many natural systems. Recently a local convex hull (LoCoH) nonparametric kernel method, which generalizes the minimum convex polygon (MCP) method, was shown to be more appropriate than parametric kernel methods for constructing HRs and UDs, because of its ability to identify hard boundaries (e.g., rivers, cliff edges) and convergence to the true distribution as sample size increases. Here we extend the LoCoH in two ways: "fixed sphere-of-influence," or r-LoCoH (kernels constructed from all points within a fixed radius r of each reference point), and an "adaptive sphere-of-influence," or a-LoCoH (kernels constructed from all points within a radius a such that the distances of all points within the radius to the reference point sum to a value less than or equal to a), and compare them to the original "fixed-number-of-points," or k-LoCoH (all kernels constructed from k-1 nearest neighbors of root points). We also compare these nonparametric LoCoH to parametric kernel methods using manufactured data and data collected from GPS collars on African buffalo in the Kruger National Park, South Africa. Our results demonstrate that LoCoH methods are superior to parametric kernel methods in estimating areas used by animals, excluding unused areas (holes) and, generally, in constructing UDs and HRs arising from the movement of animals influenced by hard boundaries and irregular structures (e.g., rocky outcrops). We also demonstrate that a-LoCoH is generally superior to k- and r-LoCoH (with software for all three methods available at http://locoh.cnr.berkeley.edu).


Conflict of interest statement

Competing Interests: The authors have declared that no competing interests exist.

Figures

Figure 1
Figure 1
The actual points used in the analysis, selected at random within boundaries defined in the methods to conform with the specified isopleth rules, are plotted here in the upper row for data sets A, B, and C. For each set, the 20% isopleth surrounds the densest aggregation of points that appear as relatively black areas in each of the plots. UDs constructed using the fixed kernel least-squares cross-validation method for these data are illustrations in the lower row (sizes have been adjusted to provide visual correspondence—where precise estimates of the fits are given in Table 1).
Figure 2
Figure 2
Kruger National Park, showing the location of the four collared buffalo used in the empirical data test of the study. The Satara and Lower Sabie regions are shown as insets 1 and 2, respectively.
Figure 3
Figure 3
Type I (dotted line), Type II (dashed line) and Total Error (solid line) (percentages) associated with the construction of 100% and 20% isopleths are plotted for the k-LoCoH, r-LoCoH, and a-LoCoH methods as a function of the parameters, k, r and a respectively for the three data sets (A, B, and C).
Figure 4
Figure 4
The effect of sample size on the optimal (i.e. error minimizing) value of parameters, k, r and a and total errors associated with the construction of the 100% isopleth using the k-LoCoH (solid line), r-LoCoH (dashed line), and a-LoCoH (dotted line) methods respectively for the three data sets (A, B, and C). Mean and standard error for fifteen randomly generated datasets for each sample size are plotted.
Figure 5
Figure 5
Illustrations of UDs constructed for data set A using k-LoCoH, r-LoCoH, and a-LoCoH methods with half, actual, and twice the optimal k, r and a parameter values. The darkest to lightest areas represent ascending decile areas from the 10th to 100th percentile isopleths.
Figure 6
Figure 6
Illustrations of UDs constructed for data set B using k-LoCoH, r-LoCoH, and a-LoCoH methods with half, actual, and twice the optimal k, r and a parameter values. The darkest to lightest areas represent ascending decile areas from the 10th to 100th percentile isopleths.
Figure 7
Figure 7
Illustrations of UDs constructed for data set B using k-LoCoH, r-LoCoH, and a-LoCoH methods with half, actual, and twice the optimal k, r and a parameter values. The darkest to lightest areas represent ascending decile areas from the 10th to 100th percentile isopleths.
Figure 8
Figure 8
Comparisons of UD constructions using an a-LoCoH estimators where the value of the parameter is â obtained using the MSHC method (see text for details), and a parametric kernel, where the smoothing parameter h is calculated using the ad-hoc method of Silverman (1986). Panels: a. collar T07 and b. collar T15, both in the Satara Region; and c. collar T13 and d. collar T16. both in the Lower Sabie Region. Black circles are GPS collar locations and the hatched shape is the exclosure in a. and b. and the ridge area in c. and d. The left figure of each panel shows the 100% isopleth in light grey and the 95% isopleth in dark grey, using the a-LoCoH method. The right figure of each panel shows the 100% kernel in light grey and the 95% parametric kernel in dark grey.

References

    1. Matosevic M, Salcic Z, Berber SA. Comparison of Accuracy Using a GPS and a Low-Cost DGPS. IEEE Transactions on Instrumentation and Measurement. 2006;55:1677–1683.
    1. Holden C. Inching toward movement ecology. Science. 2006;313:779–782. - PubMed
    1. Burt WH. Territoriality and home range concepts as applied to mammals. J Mammalogy. 1943;24:346–352.
    1. Kie JG, Baldwin JA, Evans CJ. CALHOME Home Range Analysis Program User's Manual. Fresno, California: United States Forest Service Pacific Southwest Research Station; 1994.
    1. Lawson EJG, Rodgers AR. Differences in home-range size computed in commonly used software programs. Wildlife Society Bulletin. 1997;25:721–729.

Publication types