Review
. 2007 Aug 22;4(15):625-36.
doi: 10.1098/rsif.2007.0212.

Time-dependent spectral analysis of epidemiological time-series with wavelets

Affiliations
Review

Time-dependent spectral analysis of epidemiological time-series with wavelets

Bernard Cazelles et al. J R Soc Interface. .

Abstract

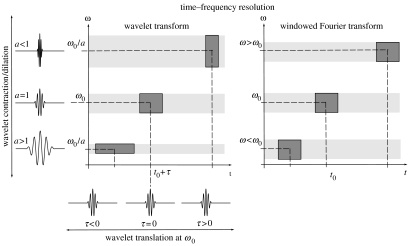
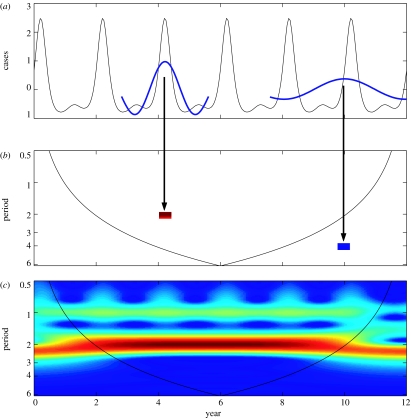
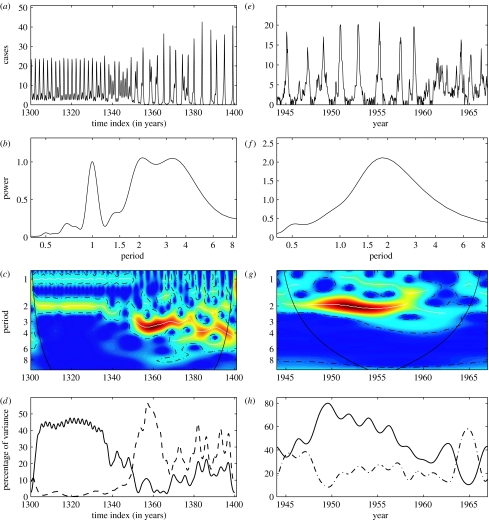
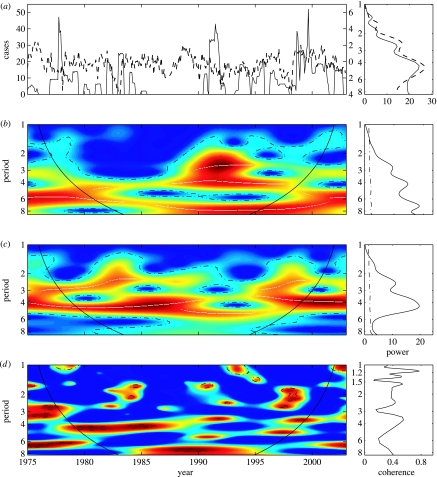
In the current context of global infectious disease risks, a better understanding of the dynamics of major epidemics is urgently needed. Time-series analysis has appeared as an interesting approach to explore the dynamics of numerous diseases. Classical time-series methods can only be used for stationary time-series (in which the statistical properties do not vary with time). However, epidemiological time-series are typically noisy, complex and strongly non-stationary. Given this specific nature, wavelet analysis appears particularly attractive because it is well suited to the analysis of non-stationary signals. Here, we review the basic properties of the wavelet approach as an appropriate and elegant method for time-series analysis in epidemiological studies. The wavelet decomposition offers several advantages that are discussed in this paper based on epidemiological examples. In particular, the wavelet approach permits analysis of transient relationships between two signals and is especially suitable for gradual change in force by exogenous variables.


Figures

Figure 1
Figure 1
Time–frequency resolution of the wavelet approach. (a) Examples of wavelets and their time–frequency boxes representing the corresponding variance (energy) distribution. When the scale a decreases, the time resolution improves but the frequency resolution gets poorer and is shifted towards high frequencies. Conversely, if a increases the boxes shift towards the region of low frequencies and the height of the boxes becomes shorter (with a better frequency resolution) but their widths are longer (with a poor time resolution). (b) In contrast with wavelets, all the boxes of the windowed Fourier transform are obtained by a time- or frequency shift of a unique function, which yields the same variance spreads over the entire time–frequency plane.
Figure 2
Figure 2
Wavelet power spectrum of an epidemiological time-series. (a) A time-series of the infectious generated by the classical SEIR model (Aron & Schwartz 1984). On this time-series Morlet wavelets with a scale (period) a=2-year and a=4-year are superimposed at time position τ1=4.2 and τ2=10, respectively. (b) Wavelet power spectrum (Sx(a, τ)) are plotted as function of time and period in a two-dimensional graph. As an example, the graph shows the value of Sx(a, τi) for a=2-year at τ1=4.2 year and for a=4-year at τ2=10 year. At τ1 for a=2-years, the matching between the time-series and the wavelet is high, this gives a high positive value of the wavelet transform and a high value for the wavelet power spectrum (Sx(a, τ)) at this time position for this periodic component. This high value of Sx(a, τ1) is shown in dark red in the two-dimensional time-period plot (b). Similarly, when the matching is weak as at τ2 for a=4-years, the low value for the wavelet power spectrum is shown in dark blue (b). (c) The complete two-dimensional plot is obtained simply by computing wavelet transforms and wavelet power spectrum for a given range of a and τ values. The colours code for power values from dark blue, low values, to dark red, high values. The SEIR model used is given by: dS/dt=μ−β(t)SIμS; dE/dt=β(t)SI−(μ+α)E; dI/dt=αE−(μ+γ)I; dR/dt=(γIμ)R; with S+E+I+R=1, μ the birth and death rates, 1/α the duration of the latency period, 1/γ the effective infectious period and β the contact rate with β(t)=β0(1+β1cos 2πt) (Aron & Schwartz 1984). The parameter values used are: α=35.84, μ=0.02, γ=100, β0=1800, β1=0.10.
Figure 3
Figure 3
Wavelet analysis for the characterization of evolving epidemics. (a–c) Time-series of the infectious population generated by a chaotic SEIR model. The SEIR model is described in the figure 2 caption and details concerning the transients can be found in Tidd et al. (1993). The parameter values are identical than those used in figure 2 but β1=0.28. (df) Monthly reported measles cases in York (Grenfell et al. 2001). (a) and (e) The time-series have been square root transformed. (b) and (f) Classical Fourier spectrum of the time-series. (c) and (g) Wavelet power spectrum (Sx(a, τ)) of the time-series. The colours code for power values from dark blue, low values, to dark red, high values. On these graphs, the dotted white lines show the maxima of the undulations of the wavelet power spectrum and the dotted-dashed lines show the α=5% significant levels computed based on 1000 bootstrapped series. On the two-dimensional graphs, the cone of influence which indicates the region not influenced by edge effects is also shown. (d) and (h) The time evolution of the % of variance of the studied time-series for different oscillating modes: 2-year mode (solid line), 1-year mode (dotted-dashed line) and 3–4 year mode (dashed line).
Figure 4
Figure 4
Wavelet analysis of the transient relationship between cholera incidence in Ghana and SOI. (a) (i) the analysed time-series: the cholera incidence (solid lines) and the SOI (dashed lines). The incidence series are square root transformed, and all series are filtered and normalized before analyses. (a) (ii) the Fourier spectrum for the cholera incidence series (solid line) and for the SOI (dashed line). The y-axis describes period (in year) as for other y-axis of (bd) graphs. (b) (i) wavelet power spectrum (Sx(a, τ)) of the cholera incidence. The colours code for power values from dark blue, low values, to dark red, high values. On this graph, the white line shows the maxima of the undulations of the wavelet power spectrum. (b) (ii) the average wavelet spectrum (S¯x(a)) of cholera incidence. (c) as in (b) but for the SOI. (d) (i) Wavelet coherence between cholera incidence in Ghana and the SOI. The colours are coded a dark blue, low coherence and dark red, high coherence. (d) (ii) Classical Fourier coherence between cholera incidence and the SOI. On (bd), the dotted-dashed lines showed the α=5% significant levels computed based on 1000 bootstrapped series and on the two-dimensional graphs the cone of influence, which indicates the region not influenced by edge effects, is also shown.
Figure 5
Figure 5
Wavelet analysis of the synchrony between dengue incidence in Bangkok and in the rest of Thailand. The incidence series are square root transformed and all series are normalized. (a) Bangkok dengue incidence (solid line) and Thailand dengue incidence (dashed line). (b) Wavelet coherence between dengue incidence in Bangkok and in the rest of Thailand. The colours are coded a dark blue, low coherence and dark red, high coherence. The dotted-dashed lines show the α=5% significance levels computed based on 1000 bootstrapped series. The cone of influence indicates the region not influenced by edge effects. (c) Phase evolutions of the two series computed with the wavelet transform in the 2–3 year periodic band. Line symbols are as in (a) and the dotted-dashed line is for the phase difference between the two series. (d) Oscillating components computed with the wavelet transform in the 2–3 year periodic band (line symbols as in (a)). (e) Oscillating components computed with the wavelet transform in the 0.8–1.2 year periodic band (line symbols as in (a)).

References

    1. Anderson R.M, May R.M. Oxford University Press; Oxford, UK: 1991. Infectious diseases of humans.
    1. Andrieu C, Doucet A, Fitzgerald W.J. An introduction to Monte Carlo methods for Bayesian data analysis. In: Mees A.I, editor. Nonlinear dynamics and statistics. Birkhäusser; Boston, MA: 2001. pp. 169–217.
    1. Aron J.L, Schwartz I.R. Seasonality and period-doubling bifurcations in an epidemic model. J. Theor. Biol. 1984;110:665–679. - PubMed
    1. Bell M.L, Samet J.M, Dominici F. Time-series studies of particulate matter. Annu. Rev. Public Health. 2004;25:247–280. doi: 10.1146/annurev.publhealth.25.102802.124329. - DOI - PubMed
    1. Bishop Y.M.M. Statistical methods for hazards and health. Environ. Health Perspect. 1977;20:149–157. - PMC - PubMed

LinkOut - more resources