Evaluation of cortical current density imaging methods using intracranial electrocorticograms and functional MRI
- PMID: 17303438
- PMCID: PMC1995666
- DOI: 10.1016/j.neuroimage.2006.12.026
Evaluation of cortical current density imaging methods using intracranial electrocorticograms and functional MRI
Abstract
Objective: EEG source imaging provides important information regarding the underlying neural activity from noninvasive electrophysiological measurements. The aim of the present study was to evaluate source reconstruction techniques by means of the intracranial electrocorticograms (ECoGs) and functional MRI.
Methods: Five source imaging algorithms, including the minimum norm least square (MNLS), LORETA with L(p)-norm (p equal to 1, 1.5 and 2), sLORETA, the minimum L(p)-norm (p equal to 1 and 1.5; when p=2, the MNLS method is mathematically equivalent to the minimum L(p)-norm) and L(1)-norm (the linear programming) methods, were evaluated in a group of 10 human subjects, in a paradigm with somatosensory stimulation. Cortical current density (CCD) distributions were estimated from the scalp somatosensory evoked potentials (SEPs), at approximately 30 ms following electrical stimulation of median nerve at the wrist. Realistic geometry boundary element head models were constructed from the MRIs of each subject and used in the CCD analysis. Functional MRI results obtained from a motor task and sensory stimulation in all subjects were used to identify the central sulcus, motor and sensory areas. In three patients undergoing neurosurgical evaluation, ECoGs were recorded in response to the somatosensory stimulation, and were used to help determine the central sulcus and the sensory cortex.
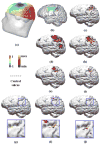
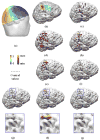
Results: The CCD distributions estimated by the L(p)-norm and LORETA-L(p) methods were smoother when the p values were high. The LORETA based on the L(1)-norm performed better than the LORETA-L(2) method for imaging well localized sources such as the P30 component of the SEP. The mean and standard deviation of the distance between the location of maximum CCD value and the central sulcus, estimated by the minimum L(p)-norm (with p equal to 1), L(1)-norm (the Linear programming) and LORETA-L(p) (with p equal to 1) methods, were 4, 7, 7 mm and 3, 4, 2 mm, respectively (after converting into Talairach coordinates). The mean and standard deviation of the aforementioned distance, estimated by the MNLS, LORETA with L(p)-norm (p equal to 1.5 and 2.0), sLORETA and the minimum L(p)-norm (p equal to 1.5) methods, were over 11 mm and 6 mm, respectively.
Conclusions: The present experimental study suggests that L(1)-norm-based algorithms provide better performance than L(2) and L(1.5)-norm-based algorithms, in the context of CCD imaging of well localized sources induced by somatosensory electrical stimulation of median nerve at the wrist.
Figures


References
-
- Babiloni F, Babiloni C, Carducci F, Romani GL, Rossini PM, Angelone LM, Cincotti F. Multimodal integration of high-resolution EEG and functional magnetic resonance imaging data: a simulation study. NeuroImage. 2003;19:1–15. - PubMed
-
- Babiloni F, Babiloni C, Carducci F, Cincotti F, Astolfi L, Basilisco A, Rossini PM, Ding L, Ni Y, Cheng J, Christine K, Sweeney J, He B. Assessing time-varying cortical functional connectivity with the multimodal integration of high resolution EEG and fMRI data by Directed Transfer Function. NeuroImage. 2005;24:118–131. - PubMed
-
- Beucker R, Schlitt HA. On Minimal lp-norm solutions of the biomagnetic inverse problem. Technical Report KFA-ZAM-IB-9614. 1996;7:1–13.
-
- Clarke J, Goubau WM, Ketchen MB. Localized and distributed source solutions for the biomagnetic inverse problem I. In: Williamson SJ, Hoke M, Stroink G, Kotani M, editors. Advances in Biomagnetism. Plenum; New York: 1989. pp. 587–590.
-
- Cohen D, Cuffin BN, Yunokuchi K, Maniewski R, Purcell C, Cosgrove GR, Ives J, Kennedy JG, Schomer DL. MEG versus EEG localization test using implanted sources in the human brain. Ann Neurol. 1990;28:811–817. - PubMed
Publication types
MeSH terms
Grants and funding
LinkOut - more resources
Full Text Sources
Other Literature Sources
Medical

