Stabilizing effect of Zn2+ in native bovine rhodopsin
- PMID: 17303564
- PMCID: PMC2043472
- DOI: 10.1074/jbc.M610341200
Stabilizing effect of Zn2+ in native bovine rhodopsin
Abstract
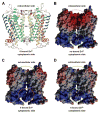
Single-molecule force spectroscopy (SMFS) is a powerful tool to dissect molecular interactions that govern the stability and function of proteins. We applied SMFS to understand the effect of Zn2+ on the molecular interactions underlying the structure of rhodopsin. Force-distance curves obtained from SMFS assays revealed the strength and location of molecular interactions that stabilize structural segments within this receptor. The inclusion of ZnCl2 in SMFS assay buffer increased the stability of most structural segments. This effect was not mimicked by CaCl2, CdCl2, or CoCl2. Thus, Zn2+ stabilizes the structure of rhodopsin in a specific manner.
Figures


Similar articles
-
Detecting molecular interactions that stabilize native bovine rhodopsin.J Mol Biol. 2006 Apr 21;358(1):255-69. doi: 10.1016/j.jmb.2006.02.008. Epub 2006 Feb 20. J Mol Biol. 2006. PMID: 16519899
-
Conservation of molecular interactions stabilizing bovine and mouse rhodopsin.Biochemistry. 2010 Dec 14;49(49):10412-20. doi: 10.1021/bi101345x. Epub 2010 Nov 11. Biochemistry. 2010. PMID: 21038881 Free PMC article.
-
Thermal destabilization of rhodopsin and opsin by proteolytic cleavage in bovine rod outer segment disk membranes.Biochemistry. 2001 Sep 18;40(37):11176-83. doi: 10.1021/bi0100539. Biochemistry. 2001. PMID: 11551216
-
G protein-coupled receptor rhodopsin.Annu Rev Biochem. 2006;75:743-67. doi: 10.1146/annurev.biochem.75.103004.142743. Annu Rev Biochem. 2006. PMID: 16756510 Free PMC article. Review.
-
Rhodopsin, Zn(2+), and retinitis pigmentosa: a short tale requiring continuation.Biochemistry (Mosc). 2013 Jun;78(6):660-6. doi: 10.1134/S0006297913060114. Biochemistry (Mosc). 2013. PMID: 23980892 Review.
Cited by
-
Understanding the Rhodopsin Worldview Through Atomic Force Microscopy (AFM): Structure, Stability, and Activity Studies.Chem Rec. 2023 Oct;23(10):e202300113. doi: 10.1002/tcr.202300113. Epub 2023 Jun 2. Chem Rec. 2023. PMID: 37265335 Free PMC article. Review.
-
Chemistry and biology of the initial steps in vision: the Friedenwald lecture.Invest Ophthalmol Vis Sci. 2014 Oct 22;55(10):6651-72. doi: 10.1167/iovs.14-15502. Invest Ophthalmol Vis Sci. 2014. PMID: 25338686 Free PMC article.
-
Light-induced photoreceptor and RPE degeneration involve zinc toxicity and are attenuated by pyruvate, nicotinamide, or cyclic light.Mol Vis. 2010 Dec 8;16:2639-52. Mol Vis. 2010. PMID: 21179242 Free PMC article.
-
Modulation of molecular interactions and function by rhodopsin palmitylation.Biochemistry. 2009 May 26;48(20):4294-304. doi: 10.1021/bi900417b. Biochemistry. 2009. PMID: 19348429 Free PMC article.
-
NS3 protease from hepatitis C virus: biophysical studies on an intrinsically disordered protein domain.Int J Mol Sci. 2013 Jun 26;14(7):13282-306. doi: 10.3390/ijms140713282. Int J Mol Sci. 2013. PMID: 23803659 Free PMC article. Review.
References
Publication types
MeSH terms
Substances
Grants and funding
LinkOut - more resources
Full Text Sources

