. 2007 May 15;581(Pt 1):255-75.
doi: 10.1113/jphysiol.2007.128785. Epub 2007 Feb 15.

Effects of flecainide and quinidine on arrhythmogenic properties of Scn5a+/- murine hearts modelling the Brugada syndrome

Affiliations

Effects of flecainide and quinidine on arrhythmogenic properties of Scn5a+/- murine hearts modelling the Brugada syndrome

Kate S Stokoe et al. J Physiol. .

Abstract

Brugada syndrome (BrS) is associated with a loss of Na+ channel function and an increased incidence of rapid polymorphic ventricular tachycardia (VT) and sudden cardiac death. A programmed electrical stimulation (PES) technique assessed arrhythmic tendency in Langendorff-perfused wild-type (WT) and genetically modified (Scn5a+/-) 'loss-of-function' murine hearts in the presence and absence of flecainide and quinidine, and the extent to which Scn5a+/- hearts model the human BrS. Extra-stimuli (S2), applied to the right ventricular epicardium, followed trains of pacing stimuli (S1) at progressively reduced S1-S2 intervals. These triggered VT in 16 out of 29 untreated Scn5a+/- and zero out of 31 WT hearts. VT occurred in 11 out of 16 (10 microM) flecainide-treated WT and nine out of the 13 initially non-arrhythmogenic Scn5a+/- hearts treated with (1.0 microM) flecainide. Quinidine (10 microM) prevented VT in six out of six flecainide-treated WT and 13 out of the 16 arrhythmogenic Scn5a+/- hearts in parallel with its clinical effects. Paced electrogram fractionation analysis demonstrated increased electrogram durations, expressed as electrogram duration (EGD) ratios, with shortening S1-S2 intervals in arrhythmogenic Scn5a+/- hearts, and prolonged ventricular effective refractory periods (VERPs) in non-arrhythmogenic Scn5a+/- hearts. Flecainide increased EGD ratios in WT (at 10 microM) and non-arrhythmogenic Scn5a+/- hearts (at 1.0 microM), whereas quinidine (10 microM) reduced EGD ratios and prolonged VERPs in WT and arrhythmogenic Scn5a+/- hearts. However, epicardial and endocardial monophasic action potential recordings consistently demonstrated positive gradients of repolarization in WT, arrhythmogenic and non-arrhythmogenic Scn5a+/- hearts under all pharmacological conditions. Together, these findings demonstrate proarrhythmic effects of flecainide in WT and Scn5a+/- murine hearts that recapitulate its clinical effects. They further attribute the arrhythmogenic phenomena observed here to re-entrant substrates resulting from delayed epicardial activation despite an absence of transmural heterogeneities of repolarization, in sharp contrast to recent characterizations in 'gain-of-function' Scn5a+/Delta murine hearts modelling the long-QT(3) syndrome.


Figures

Figure 1
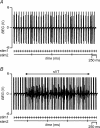
Figure 1. Bipolar electrogram (BEG) traces recorded from an arrhythmogenic Scn5a+/− heart subject to programmed electrical stimulation
A, an extra cellular BEG trace showing two episodes of non-sustained ventricular tachycardia (nsVT) each induced by an extra-stimulus (stim2) in a typical, untreated arrhythmogenic Scn5a+/− whole mouse heart preparation paced at 8 Hz. B, an episode of sustained VT (sVT) initiated by an extra-stimulus applied to the same heart. C, a persistent regular rhythm in the presence of (10 μm) quinidine. The vertical axis represents BEG voltages (V) and the horizontal axis time (ms). The single vertical markers indicate the timing of S1 stimuli (stim1), with double vertical markers representing S2 extra-stimuli.
Figure 2
Figure 2. Bipolar electrogram (BEG) traces recorded from a non-arrhythmogenic Scn5a+/− heart subject to programmed electrical stimulation
A, an extracellular BEG trace showing a persistent regular rhythm in a typical, untreated non-arrhythmogenic Scn5a+/− whole mouse heart preparation paced at 8 Hz. B, an episode of sustained ventricular tachycardia (sVT) initiated by an extra-stimulus (stim2) applied to the same heart in the presence of (1.0 μm) flecainide. The vertical axis represents BEG voltages (V) and the horizontal axis time (ms). The single vertical markers indicate the timing of S1 stimuli (stim1), with double vertical markers representing S2 extra-stimuli.
Figure 3
Figure 3. Construction of conduction curves from bipolar electrogram peak and trough data
Section of a BEG trace (inset) acquired from an isolated, perfused WT whole mouse heart paced at 8 Hz. The S1 and S2 stimulation artefacts are each followed closely by an electrogram response (S1EG, S2EG). Conduction curves were derived by application of a paced electrogram fractionation analysis procedure to peak and trough BEG data (see arrows) recorded prior to the preparation becoming refractory. The S1—S2 interval corresponding to the ventricular effective refractory period (VERP) is identified as the abscissa of point a (circled).
Figure 4
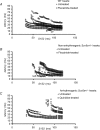
Figure 4. Conduction curves derived from paced electrogram fractionation analysis
Conduction curves generated by application of paced electrogram fractionation analysis (PEFA) to programmed electrical stimulation (PES) data acquired from WT (A), non-arrhythmogenic Scn5a+/− (B) and arrhythmogenic Scn5a+/− hearts (C) at 8 Hz prior to pharmacological intervention (+) and following treatment with flecainide (A, 10 μm; B, 1.0 μm) and quinidine (C, 10 μm) (○). The vertical axis denotes conduction latency (ms) and the horizontal axis S1–S2 interval (ms).
Figure 5
Figure 5. Comparison of PEFA parameters derived from WT and Scn5a+/− hearts
Values of EGD ratio (A), VERP (B) and conduction latency (C) (mean ± s.e.m.) derived from BEG data recorded during PES from untreated WT (open bars), non-arrhythmogenic (crossed bars) and arrhythmogenic Scn5a+/− hearts (striped bars) paced at 8 and 10 Hz, respectively. Significance levels of *P < 0.05, **P < 0.005 and ***P < 0.0005 (one-way ANOVA for independent samples) reflect marked differences between Scn5a+/− hearts and WT hearts.
Figure 6
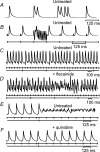
Figure 6. Monophasic action potentials recorded from initially arrhythmogenic and non-arrhythmogenic Scn5a+/− hearts
Monophasic action potentials (APs) recorded from the epicardium of intrinsically (A) and extrinsically paced (B–F) initially arrhythmogenic (A and B, E and F) and non-arrhythmogenic Scn5a+/− hearts (C and D). Experiments were performed in the absence (A) and presence of electrical stimulation prior to (B) and during programmed electrical stimulation (PES) (C–F), before (A–C and E) and subsequent to perfusion with (1.0 μm) flecainide (D) and (10 μm) quinidine (F). The single vertical markers represent S1 stimuli and the double vertical markers S2 extra-stimuli. Of the spontaneous events observed both A, extra beats initiated by triggering events late in the AP, and B, an episode of spontaneous ventricular tachycardia (VT) occurring following regular S1 pacing, were observed in only one heart. C, persistent, regular rhythm in an untreated non-arrhythmogenic Scn5a+/− heart paced at 10 Hz during PES. D, an episode of non-sustained VT initiated by an extra-stimulus (S2) applied to the same heart in the presence of flecainide. E, sustained VT initiated by an extra-stimulus (S2) during PES at 8 Hz in an untreated arrhythmogenic Scn5a+/− heart. F, regular rhythm recorded from the same heart treated with quinidine.
Figure 7
Figure 7. Monophasic action potential waveforms recorded from WT hearts
Monophasic action potentials (MAP) waveforms recorded from the epicardium and endocardium of typical WT hearts paced at 8 Hz prior to and during treatment with flecainide (10 μm: B and C) and quinidine (10 μm: E and F). The top panel shows epicardial and endocardial MAPs overlaid to emphasize waveform differences in untreated hearts (A and D). The lower two panels illustrate the effects of flecainide and quinidine on AP waveform by superimposing records obtained from the epicardium (‘epi’: B and E) and endocardium (‘endo’: C and F) before (designated ‘epi’ or ‘endo’) and during treatment (‘+ flecainide’ or ‘+ quinidine’).
Figure 8
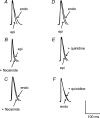
Figure 8. Monophasic action potential waveforms recorded from Scn5a+/− hearts
Monophasic action potential (MAP) waveforms recorded from the epicardium and endocardium of typical non-arrhythmogenic (A–C) and arrhythmogenic (D–F) Scn5a+/− hearts paced at 8 Hz prior to and during treatment with flecainide (1 μm: B and C) and quinidine (10 μm; E and F). The top panel shows epicardial and endocardial MAPs overlaid to emphasize waveform differences in untreated hearts (A and D). The lower two panels illustrate the effects of flecainide and quinidine on AP waveform by superimposing records obtained from the epicardium (‘epi’: B and E) and endocardium (‘endo’: C and F) before (designated ‘epi’ or ‘endo’) and during treatment (‘+ flecainide’ or ‘+ quinidine’).
Figure 9
Figure 9. Action potential durations in WT hearts
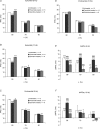
Epicardial (A and B) and endocardial (C and D) action potential durations (APDx) and the empirical difference (ΔAPDx = endocardial APDx − epicardial APDx) (E and F) at x = 90%, 70% and 50% repolarization (ms) (mean ± s.e.m.) in WT hearts paced at 8 Hz and 10 Hz in the absence (open bars) and presence of flecainide (10 μm: crossed bars) and quinidine (10 μm: striped bars). The results of one-way ANOVA for correlated samples are shown (*P < 0.05, **P < 0.005 and ***P < 0.0005) and compare the relative effects of pharmacological intervention; an asterisk(s) indicates that treatment significantly altered APDx relative to its untreated control. ΔAPDx values tested against a zero ΔAPDx are shown to significance levels of †P < 0.05, ††P < 0.01 and †††P < 0.001, respectively. ΔAPDx values obtained from WT hearts treated with flecainide or quinidine are also compared to values obtained from untreated WT hearts to significance levels of §P < 0.05, §§P < 0.01 and §§§P < 0.001, respectively.
Figure 10
Figure 10. Action potential durations in nonarrhythmogenic Scn5a+/− hearts
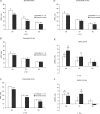
Epicardial (A and B) and endocardial (C and D) action potential durations (APDx) and the empirical difference (ΔAPDx = endocardial APDx − epicardial APDx) (C), at x = 90%, 70% and 50% repolarization (ms) (mean ± s.e.m.) in non-arrhythmogenic Scn5a+/− hearts paced at 8 Hz and 10 Hz in the absence (clear bars) and presence of flecainide (1.0 μm: crossed bars). The results of one-way ANOVA for correlated samples are shown (*P < 0.05, **P < 0.005 and ***P < 0.0005) and compare the relative effects of pharmacological intervention; an asterisk(s) indicates that treatment significantly altered APDx relative to its untreated control. ΔAPDx values tested against a zero ΔAPDx are shown to significance levels of †P < 0.05, ††P < 0.01 and †††P < 0.001, respectively. ΔAPDx values obtained from non-arrhythmogenic Scn5a+/− hearts treated with flecainide are also compared to values obtained from untreated non-arrhythmogenic Scn5a+/− hearts to significance levels of §P < 0.05, §§P < 0.01 and §§§P < 0.001, respectively. a denotes P < 0.0005, b denotes P < 0.005, c denotes P < 0.05, d denotes P < 0.001, e denotes P < 0.01 and f denotes P < 0.05 when compared with the corresponding reading in Fig. 9 (see untreated WT hearts).
Figure 11
Figure 11. Action potential durations in arrhythmogenic Scn5a+/− hearts
Epicardial (A and B) and endocardial (C and D) action potential durations (APDx) and the empirical difference (ΔAPDx = endocardial APDx − epicardial APDx) (E and F) at x = 90%, 70% and 50% repolarization (ms) (mean ± s.e.m.) in arrhythmogenic Scn5a+/− hearts paced at 8 Hz and 10 Hz in the absence (open bars) and presence of quinidine (10 μm: striped bars). The results of one-way ANOVA for correlated samples are shown (*P < 0.05, **P < 0.005 and ***P < 0.0005) and compare the relative effects of pharmacological intervention; an asterisk(s) indicates that treatment significantly altered APDx relative to its untreated control. ΔAPDx values tested against a zero ΔAPDx are shown to significance levels of †P < 0.05, ††P < 0.01 and †††P < 0.001, respectively. ΔAPDx values obtained from arrhythmogenic Scn5a+/− hearts treated with quinidine are also compared to values obtained from untreated arrhythmogenic Scn5a+/− hearts to significance levels of §P < 0.05, §§P < 0.01 and §§§P < 0.001, respectively. a denotes P < 0.0005, b denotes P < 0.005, c denotes P < 0.05, d denotes P < 0.001, e denotes P < 0.01 and f denotes P < 0.05 when compared with the corresponding reading in Fig. 9 (see untreated WT hearts).

Similar articles

Cited by

References

    1. Akar FG, Wu RC, Deschenes I, Armoundas AA, Piacentino V, 3rd, Houser SR, Tomaselli GF. Phenotypic differences in transient outward K+ current of human and canine ventricular myocytes: insights into molecular composition of ventricular Ito. Am J Physiol Heart Circ Physiol. 2004;286:H602–H609. - PubMed
    1. Alings M, Dekker L, Sadee A, Wilde A. Quinidine-induced electrocardiographic normalization in two patients with Brugada syndrome. Pacing Clin Electrophysiol. 2001;24:1420–1422. - PubMed
    1. Alings M, Wilde A. ‘Brugada’ syndrome: clinical data and suggested pathophysiological mechanism. Circulation. 1999;99:666–673. - PubMed
    1. Anderson JL, Platia EV, Hallstrom A, Henthorn RW, Buckingham TA, Carlson MD, Carson PE. Interaction of baseline characteristics with the hazard of encainide, flecainide, and moricizine therapy in patients with myocardial infarction. A possible explanation for increased mortality in the Cardiac Arrhythmia Suppression Trial (CAST) Circulation. 1994;90:2843–2852. - PubMed
    1. Anno T, Hondeghem LM. Interactions of flecainide with guinea pig cardiac sodium channels. Importance of activation unblocking to the voltage dependence of recovery. Circ Res. 1990;66:789–803. - PubMed

Publication types

MeSH terms

LinkOut - more resources