. 2007 Mar;117(3):823-34.
doi: 10.1172/JCI26833. Epub 2007 Feb 15.

Gene expression analysis of peripheral T cell lymphoma, unspecified, reveals distinct profiles and new potential therapeutic targets

Affiliations

Gene expression analysis of peripheral T cell lymphoma, unspecified, reveals distinct profiles and new potential therapeutic targets

Pier Paolo Piccaluga et al. J Clin Invest. 2007 Mar.

Abstract

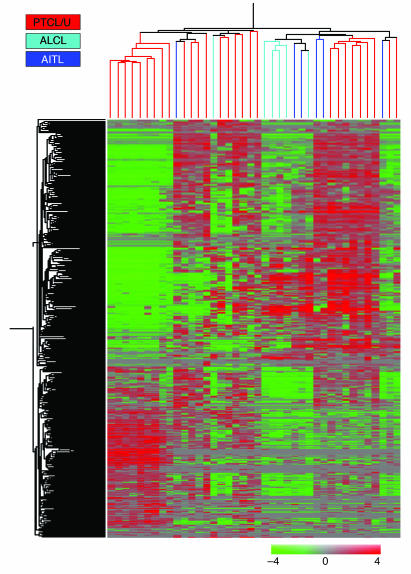
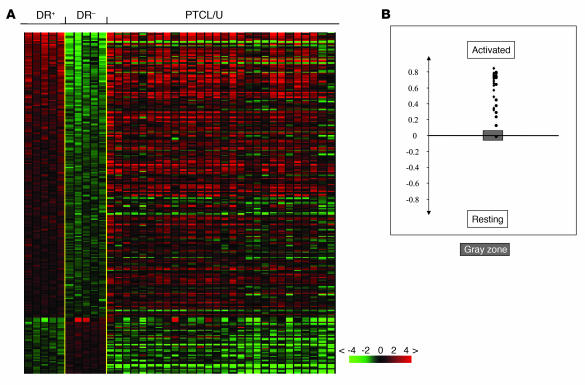
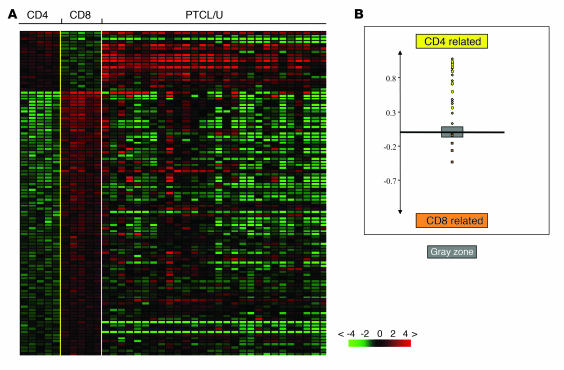
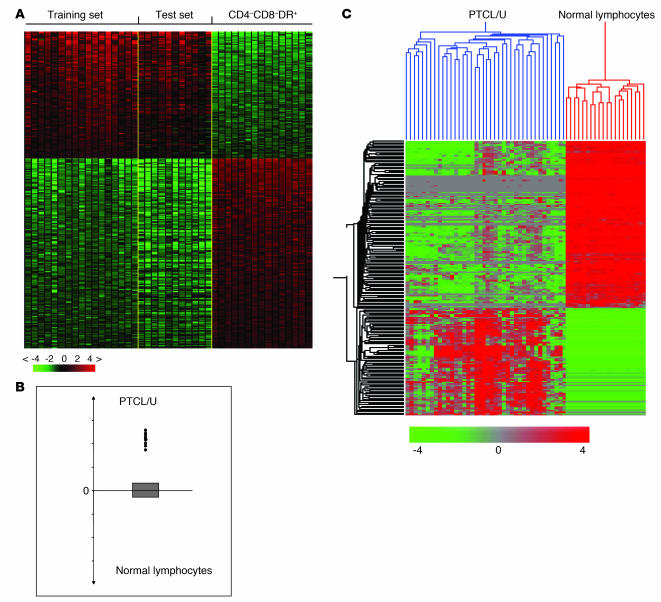
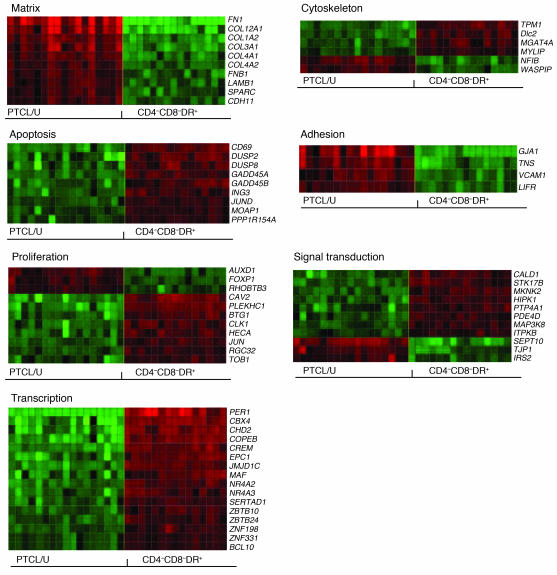
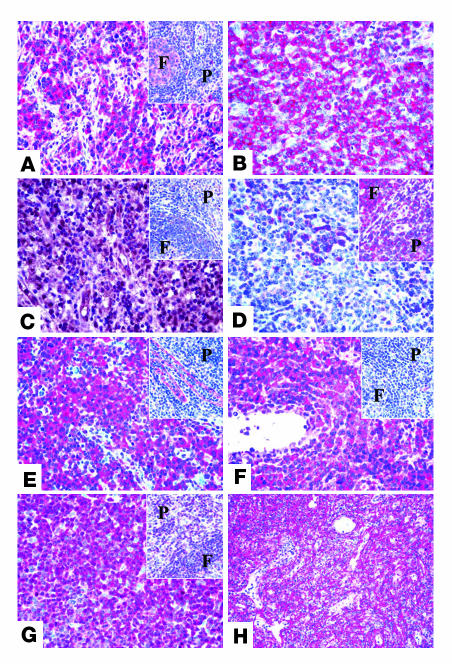
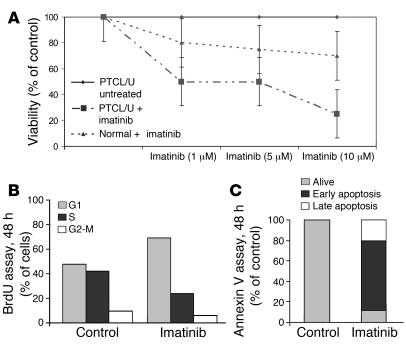
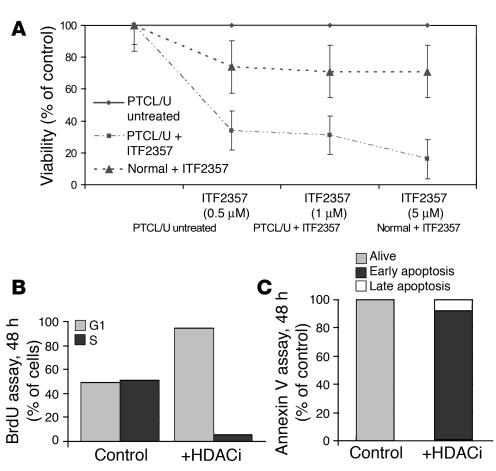
Peripheral T cell lymphoma, unspecified (PTCL/U), the most common form of PTCL, displays heterogeneous morphology and phenotype, poor response to treatment, and poor prognosis. We demonstrate that PTCL/U shows a gene expression profile clearly distinct from that of normal T cells. Comparison with the profiles of purified T cell subpopulations (CD4+, CD8+, resting [HLA-DR-], and activated [HLA-DR+]) reveals that PTCLs/U are most closely related to activated peripheral T lymphocytes, either CD4+ or CD8+. Interestingly, the global gene expression profile cannot be surrogated by routine CD4/CD8 immunohistochemistry. When compared with normal T cells, PTCLs/U display deregulation of functional programs often involved in tumorigenesis (e.g., apoptosis, proliferation, cell adhesion, and matrix remodeling). Products of deregulated genes can be detected in PTCLs/U by immunohistochemistry with an ectopic, paraphysiologic, or stromal location. PTCLs/U aberrantly express, among others, PDGFRalpha, a tyrosine-kinase receptor, whose deregulation is often related to a malignant phenotype. Notably, both phosphorylation of PDGFRalpha and sensitivity of cultured PTCL cells to imatinib (as well as to an inhibitor of histone deacetylase) were found. These results, which might be extended to other more rare PTCL categories, provide insight into tumor pathogenesis and clinical management of PTCL/U.


Figures

Figure 1
Figure 1. Unsupervised hierarchical clustering of PTCL/U, AITL, and ALCL.
Unsupervised analysis performed on 28 PTCL/U, 6 AITL, and 6 ALCL samples. The 40 samples are clustered according to the expression of 417 genes. While ALCLs roughly cluster together, AITLs are scattered within PTCL/U.
Figure 2
Figure 2. Relatedness of PTCL/U to resting and activated normal lymphocytes.
Relatedness of the gene expression profile of PTCL/U to normal T cell populations. (A) A supervised analysis was used to identify the genes differentially expressed between 2 groups of samples. HLA-DR+ (activated) T cells are compared with HLA-DR (resting) T cells. The expression of the selected genes is investigated in PTCLs/U, represented on the right side of the matrix. (B) A cell-type classification is used to measure the relatedness of PTCL/U to HLA-DR+ and HLA-DR T cells. The gray area marks 95% confidence: the P value decreases with increasing distance from the x axis.
Figure 3
Figure 3. Relatedness of PTCL/U to CD4 and CD8 normal lymphocytes.
Relatedness of the gene expression profile of PTCL/U to normal T cell populations. A supervised analysis was used to identify the genes differentially expressed between 2 groups of samples. (A) CD4+ T cells are compared with CD8+ T cells. The expression of the selected genes is investigated in PTCLs/U, represented on the right side of the matrix. (B) A cell-type classification is used to measure the relatedness of PTCL/U to CD4+ and CD8+ T cells. The gray area marks 95% confidence: the P value decreases with increasing distance from the x axis.
Figure 4
Figure 4. Supervised analysis of PTCL/U and normal lymphocytes identifies differentially expressed genes.
Identification of genes differentially expressed in PTCL/U and normal T lymphocytes. Supervised analysis was performed using 17 samples of PTCL/U (training set) versus the 3 normal T cell subpopulations identified as the closest normal counterparts (CD4+, CD8+, and HLA-DR+). The support value for the analysis was chosen as n = n0 (n0, number of samples in the phenotype set). (A) The analysis identified 155 genes that are differentially expressed in PTCL/U versus all the other samples (Supplemental Tables 5 and 6). The expression of the 155 genes was then investigated and validated in an independent test set (11 PTCL/U cases), represented on the right side of the matrix. (B) A cell-type classification is used to measure the relatedness of test set cases to PTCL/U (training set) and normal T cells. The gray area marks 95% of confidence: the P value decreases with increasing distance from the x axis. (C) In addition, the identified 155 genes correctly classified all the 11 PTCLs/U of the test set in unsupervised analysis.
Figure 5
Figure 5. Cellular programs deregulated in PTCL/U.
Fifty-seven of the 155 genes found to be differentially expressed in PTCL/U and normal T lymphocytes could be classified according to 7 functional categories known to be particularly relevant to malignant behavior. Gene names are indicated. For description of the matrix, see the legend to Figure 4.
Figure 6
Figure 6. Immunohistochemical validation of gene expression results on TMAs.
Examples of the immunostaining patterns for PDGFRα (A), p-PDGFRα (B), CYR61 (C), BCL10 (D), IGFBP7 (E), LIFR (F), p27 (G), and caldesmon (H). The insets show the staining for the corresponding marker in normal lymphoid tissue (F, follicle; P, paracortex/T zone). Original magnification, ×400.
Figure 7
Figure 7. Imatinib mesylate reduces PTCL/U primary cells' viability ex vivo.
(A) PTCL/U and normal T cells were incubated for 48 hours in media containing 10% FBS with or without imatinib at concentrations of 1, 5, and 10 μM. Imatinib induced concentration-dependent growth inhibition of PTCL/U primary cells with a very scarce effect on normal T lymphocyte viability. The results are plotted as the percentage of control untreated cells. Bars indicate the SEM of triplicate samples. (B and C) This effect was consistent with the G0/G1 cell cycle arrest and apoptosis induction.
Figure 8
Figure 8. ITF2357 reduces PTCL/U primary cells’ viability ex vivo.
(A) PTCL/U and normal T cells were incubated for 48 hours in media containing 10% FBS with or without ITF2357 at concentrations of 0.5, 1, and 5 μM. ITF2357 induced concentration-dependent growth inhibition of PTCL/U primary cells with a scarce effect on normal T lymphocyte viability. The results are plotted as the percentage of control untreated cells. Bars indicate the SEM of triplicate samples. (B and C) This effect was consistent with the G0/G1 cell cycle arrest and apoptosis induction.

References

    1. Jaffe, E.S., and Ralfkiaer, E. 2001. Pathology and genetics of tumours of haematopoietic and lymphoid tissues. IARC Press. Lyon, France. 191–194.
    1. Kadin M.E., Berard C.W., Nanba K., Wakasa H. Lymphoproliferative diseases in Japan and Western countries: Proceedings of the United States–Japan Seminar, September 6 and 7, 1982, in Seattle, Washington. Hum. Pathol. 1983;14:745–772. - PubMed
    1. Harris N.L., et al. A revised European-American classification of lymphoid neoplasms: a proposal from the International Lymphoma Study Group. Blood. 1994;84:1361–1392. - PubMed
    1. Lopez-Guillermo A., et al. Peripheral T-cell lymphomas: initial features, natural history, and prognostic factors in a series of 174 patients diagnosed according to the R.E.A.L. Classification. Ann. Oncol. 1998;9:849–855. - PubMed
    1. Rizvi M.A., Evens A.M., Tallman M.S., Nelson B.P., Rosen S.T. T-cell non-Hodgkin lymphoma. Blood. 2006;107:1255–1264. - PubMed

Publication types

Substances