Magnetization transfer effects on the efficiency of flow-driven adiabatic fast passage inversion of arterial blood
- PMID: 17304639
- PMCID: PMC2867234
- DOI: 10.1002/nbm.1137
Magnetization transfer effects on the efficiency of flow-driven adiabatic fast passage inversion of arterial blood
Abstract
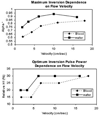
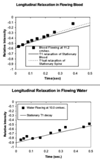
Continuous arterial spin labeling experiments typically use flow-driven adiabatic fast passage inversion of the arterial blood water protons. In this article, we measure the effect of magnetization transfer in blood and how it affects the inversion label. We use modified Bloch equations to model flow-driven adiabatic inversion in the presence of magnetization transfer in blood flowing at velocities from 1 to 30 cm/s in order to explain our findings. Magnetization transfer results in a reduction of the inversion efficiency at the inversion plane of up to 3.65% in the range of velocities examined, as well as faster relaxation of the arterial label in continuous labeling experiments. The two effects combined can result in inversion efficiency reduction of up to 8.91% in the simulated range of velocities. These effects are strongly dependent on the velocity of the flowing blood, with 10 cm/s yielding the largest loss in efficiency due to magnetization transfer effects. Flowing blood phantom experiments confirmed faster relaxation of the inversion label than that predicted by T(1) decay alone.
Figures


Similar articles
-
Velocity-driven adiabatic fast passage for arterial spin labeling: results from a computer model.Magn Reson Med. 2003 Feb;49(2):398-401. doi: 10.1002/mrm.10363. Magn Reson Med. 2003. PMID: 12541264
-
Wedge-shaped slice-selective adiabatic inversion pulse for controlling temporal width of bolus in pulsed arterial spin labeling.Magn Reson Med. 2016 Sep;76(3):838-47. doi: 10.1002/mrm.25989. Epub 2015 Oct 9. Magn Reson Med. 2016. PMID: 26451521 Free PMC article.
-
Measurement of rat brain perfusion by NMR using spin labeling of arterial water: in vivo determination of the degree of spin labeling.Magn Reson Med. 1993 Mar;29(3):416-21. doi: 10.1002/mrm.1910290323. Magn Reson Med. 1993. PMID: 8383791
-
Efficiency of flow-driven adiabatic spin inversion under realistic experimental conditions: a computer simulation.Magn Reson Med. 2004 Jun;51(6):1187-93. doi: 10.1002/mrm.20080. Magn Reson Med. 2004. PMID: 15170839
-
Inversion profiles of adiabatic inversion pulses for flowing spins: the effects on labeling efficiency and labeling accuracy in perfusion imaging with pulsed arterial spin-labeling.Magn Reson Imaging. 2002 Jul;20(6):487-94. doi: 10.1016/s0730-725x(02)00525-8. Magn Reson Imaging. 2002. PMID: 12361796
Cited by
-
Determination of glucose exchange rates and permeability of erythrocyte membrane in preeclampsia and subsequent oxidative stress-related protein damage using dynamic-19F-NMR.J Biomol NMR. 2017 Feb;67(2):145-156. doi: 10.1007/s10858-017-0092-y. Epub 2017 Feb 21. J Biomol NMR. 2017. PMID: 28224261 Free PMC article.
-
T1-mapping in the heart: accuracy and precision.J Cardiovasc Magn Reson. 2014 Jan 4;16(1):2. doi: 10.1186/1532-429X-16-2. J Cardiovasc Magn Reson. 2014. PMID: 24387626 Free PMC article. Review.
-
Continuous flow-driven inversion for arterial spin labeling using pulsed radio frequency and gradient fields.Magn Reson Med. 2008 Dec;60(6):1488-97. doi: 10.1002/mrm.21790. Magn Reson Med. 2008. PMID: 19025913 Free PMC article.
-
Neural effects of short-term training on working memory.Cogn Affect Behav Neurosci. 2014 Mar;14(1):147-60. doi: 10.3758/s13415-013-0244-9. Cogn Affect Behav Neurosci. 2014. PMID: 24496717 Free PMC article.
-
Magnetic resonance imaging based noninvasive measurements of brain hemodynamics in neonates: a review.Pediatr Res. 2016 Nov;80(5):641-650. doi: 10.1038/pr.2016.146. Epub 2016 Jul 19. Pediatr Res. 2016. PMID: 27434119 Review.
References
-
- Calamante F, Williams SR, van Bruggen N, Kwong KK, Turner R. A model for quantification of perfusion in pulsed labelling techniques. NMR Biomed. 1996;9:79–83. - PubMed
-
- Kim SG. Quantification of relative cerebral blood flow change by flow-sensitive alternating inversion recovery (FAIR) technique: application to functional mapping. Magn Reson Med. 1995;34:293–301. - PubMed
-
- Kwong KK, et al. MR perfusion studies with T1-weighted echo planar imaging. Magn Reson Med. 1995;34:878–887. - PubMed
-
- Wong EC, Buxton RB, Frank LR. Quantitative imaging of perfusion using a single subtraction (QUIPSS and QUIPSS II) Magn Reson Med. 1998;39:702–708. - PubMed
-
- Alsop DC, Detre JA. Reduced transit-time sensitivity in noninvasive magnetic resonance imaging of human cerebral blood flow. J Cereb Blood Flow Metab. 1996;16:1236–1249. - PubMed
Publication types
MeSH terms
Grants and funding
LinkOut - more resources
Full Text Sources

