

Influenza-attributable deaths, Canada 1990-1999
- PMID: 17306052
- PMCID: PMC2870678
- DOI: 10.1017/S0950268807007923
Influenza-attributable deaths, Canada 1990-1999
Abstract
The number of deaths attributable to influenza is believed to be considerably higher than the number certified by vital statistics registration as due to influenza. Weekly mortality data for Canada from the 1989/1990 to the 1998/1999 influenza seasons were analysed by cause of death, age group, and place of death to estimate the impact of influenza on mortality. A Poisson regression model was found to accurately predict all-cause, as well as cause-specific mortality, as a function of influenza-certified deaths, after controlling for seasonality, and trend. Influenza-attributable deaths were calculated as predicted less baseline-predicted deaths. In summary, throughout the 1990s there were on average just under 4000 deaths attributable to influenza annually (for an influenza-attributable mortality rate of 13/100,000 persons), varying from no detectable excess mortality for the 1990/1991 influenza season, to 6000-8000 influenza-attributable deaths for the more severe influenza seasons of 1997/1998 and 1998/1999. On average, 8% (95% CI 7-10) of influenza-attributable deaths were certified as influenza, although this percentage varied from 4% to 12% from year to year. Only 15% of the influenza-attributable deaths were certified as pneumonia, and for all respiratory causes, 40%. Deaths were distributed over most causes. The weekly pattern of influenza-certified deaths was a good predictor of excess all-cause mortality.
Figures
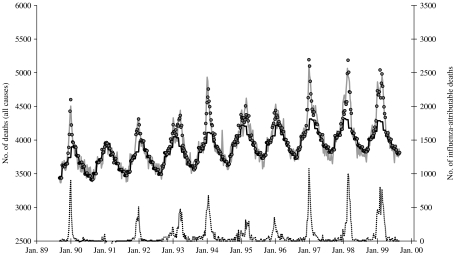
 , All deaths (excluding influenza);
  , predicted deaths; –––, baseline (predicted without influenza); ·······, influenza-attributable deaths.
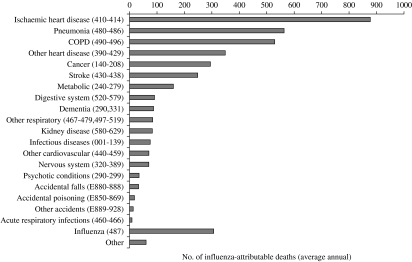
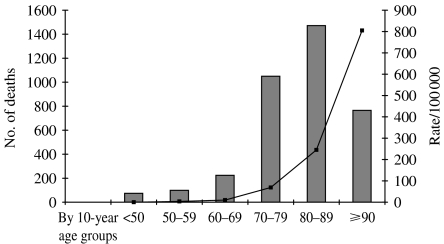
 , Influenza-attributable deaths;
  , rate/100 000.
References
-
- Simonsen L et al. Pandemic versus epidemic influenza mortality: a pattern of changing age distribution. Journal of Infectious Diseases. 1998;178:53–60. - PubMed
-
- Simonsen L et al. A method for timely assessment of influenza-associated mortality in the United States. Epidemiology. 1997;8:390–395. - PubMed
MeSH terms
LinkOut - more resources
Full Text Sources
Medical
