. 2007 Apr 1;220(1):72-82.
doi: 10.1016/j.taap.2006.12.017. Epub 2006 Dec 23.

Role of surfactant protein-A (SP-A) in lung injury in response to acute ozone exposure of SP-A deficient mice

Affiliations

Role of surfactant protein-A (SP-A) in lung injury in response to acute ozone exposure of SP-A deficient mice

Rizwanul Haque et al. Toxicol Appl Pharmacol. .

Abstract

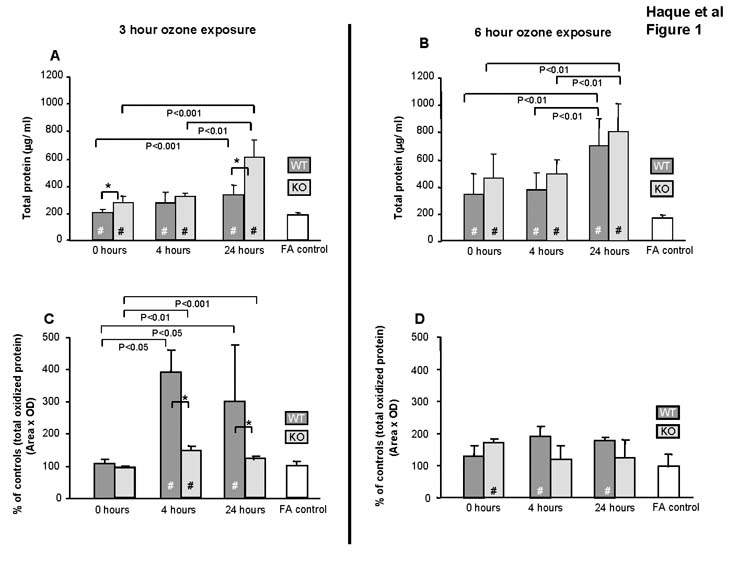
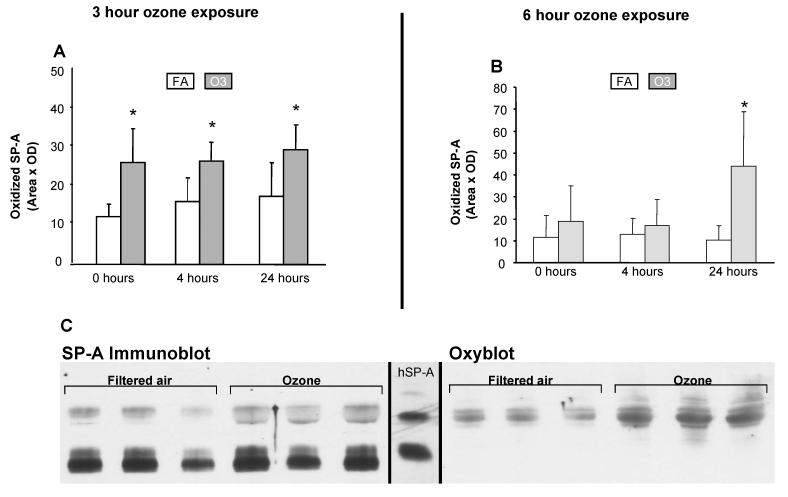
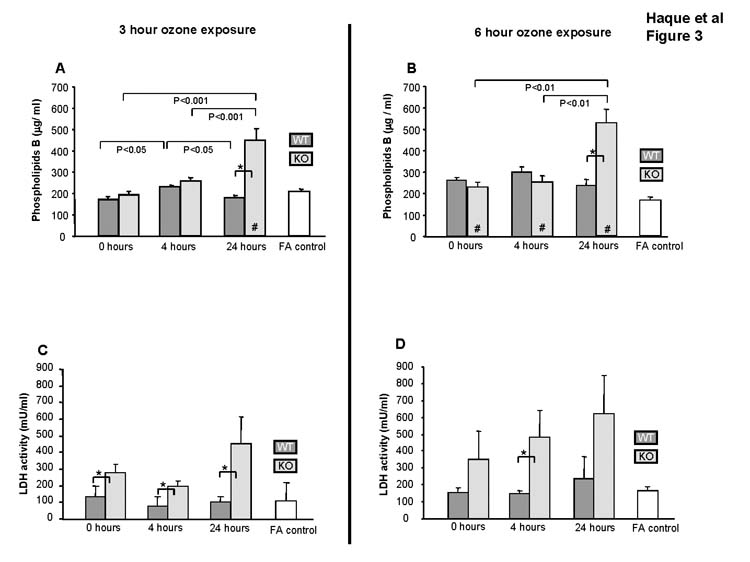
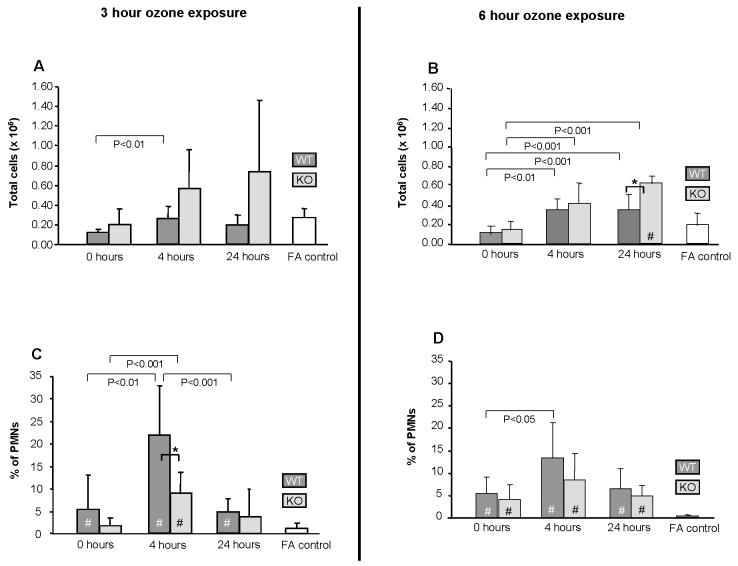
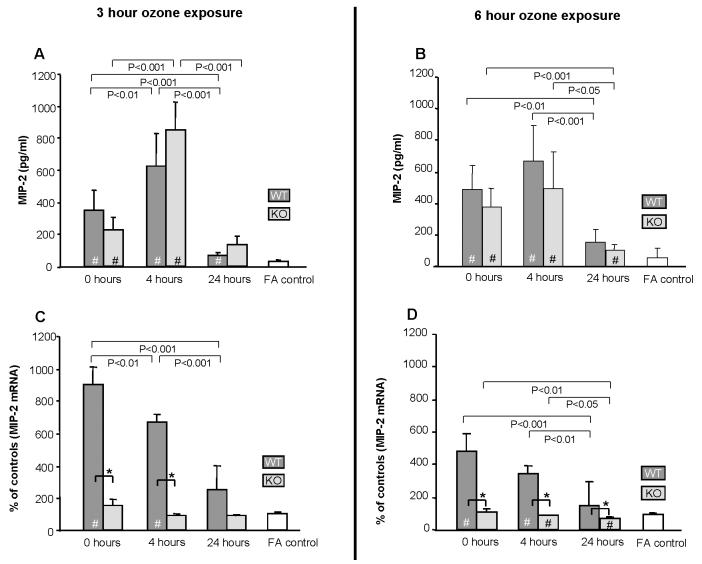
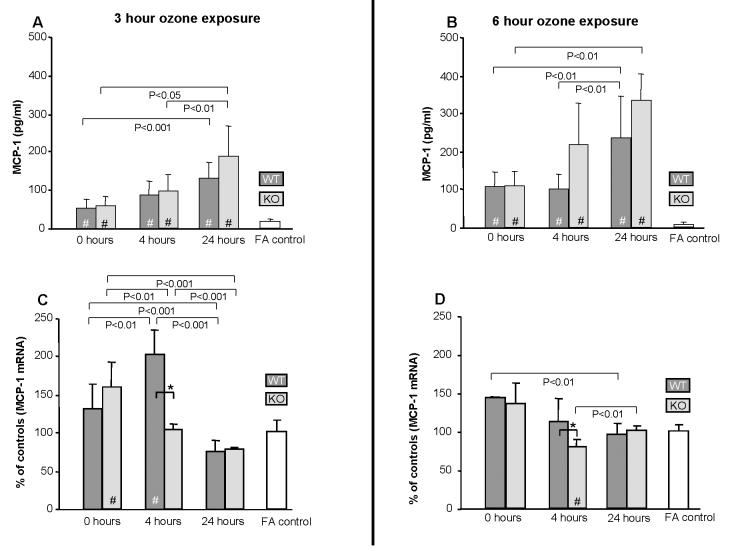
Millions are exposed to ozone levels above recommended limits, impairing lung function, causing epithelial damage and inflammation, and predisposing some individuals to pneumonia, asthma, and other lung conditions. Surfactant protein-A (SP-A) plays a role in host defense, the regulation of inflammation, and repair of tissue damage. We tested the hypothesis that the lungs of SP-A(-/-) (KO) mice are more susceptible to ozone-induced damage. We compared the effects of ozone on KO and wild type (WT) mice on the C57BL/6 genetic background by exposing them to 2 parts/million of ozone for 3 or 6 h and sacrificing them 0, 4, and 24 h later. Lungs were subject to bronchoalveolar lavage (BAL) or used to measure endpoints of oxidative stress and inflammation. Despite more total protein in BAL of KO mice after a 3 h ozone exposure, WT mice had increased oxidation of protein and had oxidized SP-A dimers. In KO mice there was epithelial damage as assessed by increased LDH activity and there was increased phospholipid content. In WT mice there were more BAL PMNs and elevated macrophage inflammatory protein (MIP)-2 and monocyte chemoattractant protein (MCP)-1. Changes in MIP-2 and MCP-1 were observed in both KO and WT, however mRNA levels differed. In KO mice MIP-2 mRNA levels changed little with ozone, but in WT levels they were significantly increased. In summary, several aspects of the inflammatory response differ between WT and KO mice. These in vivo findings appear to implicate SP-A in regulating inflammation and limiting epithelial damage in response to ozone exposure.


Figures

Figure 1
Figure 1
Effect of ozone on total protein and total oxidized protein content in BAL. Amounts of total protein (Fig. 1A and 1B) and oxidized protein (Fig. 1C and 1D) in cell-free BAL (n=6/group) were quantified after a 3hr and 6hr exposure to FA or ozone. Values (mean ± SD) for WT (dark gray bars), KO (light gray bars), and FA negative control (open bars) are shown for various post-exposure recovery times. FA values are represented by a single bar because no differences were seen in KO and WT mice for the various time points. All ozone-exposed values that are significantly different from FA controls are indicated by a (#) within the bar. In all panels differences (p≤0.05) between WT and KO after ozone-exposure are indicated by asterisks (*) and connecting bars. All other pair-wise comparisons are noted by connecting bars with the p value for each comparison shown under each connecting bar. In Fig. 1A and 1B all ozone-treated samples differ (p≤0.05) from FA. In Fig. 1C and 1D FA values at each time point are set at 100% and values in ozone-exposed mice are expressed as % of control.
Figure 2
Figure 2
Effect of ozone on oxidation of SP-A. Densitometric measurements of oxidized SP-A in BAL of WT mice exposed to ozone or FA are shown for 0, 4, and 24hr points after a 3hr (Fig. 2A) or a 6hr ozone exposure. Asterisks (*) indicate significant differences (p≤0.05) between FA and ozone-exposed samples (n=6/group). Representative Western blots of SP-A (SP-A Immunoblot) and oxidized SP-A (Oxyblot) are shown for the 4hr point after a 3hr ozone exposure (Fig. 2B). SDS gel electrophoresis was performed on concentrated samples from 200 μl of BAL fluid. The blots are immunostained with SP-A antiserum (SP-A immunoblot) or with the OxyBlot kit (Oxyblot). The SP-A bands on OxyBlot were identified by comparison with an identical SP-A immunoblot. A reference lane containing immunostained human alveolar proteinosis SP-A (hSP-A) with bands of monomeric and dimeric SP-A is shown between panels.
Figure 3
Figure 3
Effect of ozone on BAL. The levels of phospholipids (Fig. 3A and 3B) and LDH (Fig. 3C and 3D) in BAL were determined (n=3/group). Values (mean ± SD) for WT (dark gray bars), KO (light gray bars), and FA negative control (open bars) are shown for various recovery times following a 3hr and a 6 hr ozone exposure. FA values are represented by a single bar because no differences were seen in FA controls from KO and WT mice for the various time points. All ozone-exposed values that are significantly different from FA controls are indicated by a (#) within the bar. In all panels differences (p≤0.05) between WT and KO after ozone-exposure are indicated by asterisks (*) and connecting bars. All other pair-wise comparisons are noted by connecting bars with the p value for each comparison shown under each connecting bar.
Figure 4
Figure 4
Effect of ozone on the recovery of total cells and PMNs in BAL. Total (Fig. 4A and 4B) and PMN (Fig. 4C and 4D) cell counts are shown (n=6/group). Values (mean ± SD) for WT (dark gray bars), KO (light gray bars), and FA negative control (open bars) are shown for various recovery times following a 3hr ozone exposure. FA values are represented by a single bar because no differences were seen in FA controls from KO and WT mice for the various time points. All ozone-exposed values that are significantly different from FA controls are indicated by a (#) within the bar. In all panels differences (p≤0.05) between WT and KO after ozone-exposure are indicated by asterisks (*) and connecting bars. All other pair-wise comparisons are noted by connecting bars with the p value for each comparison shown under each connecting bar.
Figure 5
Figure 5
Effect of ozone on MIP-2 protein levels in BAL and mRNA in lung. MIP-2 protein (n=6/group) was assayed by ELISA (Fig. 5A and 5B) and mRNA (n=3) was determined by quantitative RT-PCR (Fig. 5C and 5D). mRNA values were corrected using 18S ribosomal RNA as internal standard and expressed as % of control for each time point. Values (mean ± SD) for WT (dark gray bars), KO (light gray bars), and FA negative control (open bars) are shown for various recovery times. FA values are represented by a single bar because no differences were seen in FA controls from KO and WT mice for the various time points. All ozone-exposed values that are significantly different from FA controls are indicated by a (#) within the bar. In all panels differences (p≤0.05) between WT and KO after ozone-exposure are indicated by asterisks (*) and connecting bars. All other pair-wise comparisons are noted by connecting bars with the p value for each comparison shown under each connecting bar.
Figure 6
Figure 6
Effect of ozone on MCP-1 protein levels in BAL and mRNA in lung. MCP-1 protein (n=6/group) was assayed by ELISA (Fig. 6A and 6B) and mRNA (n=3) was determined by quantitative RT-PCR (Fig. 6C and 6D). mRNA values were corrected using 18S ribosomal RNA as internal standard and expressed as % of control for each time point. Values (mean ± SD) for WT (dark gray bars), KO (light gray bars), and FA negative control (open bars) are shown for various recovery times. FA values are represented by a single bar because no differences were seen in FA controls from KO and WT mice for the various time points. All ozone-exposed values that are significantly different from FA controls are indicated by a (#) within the bar. In all panels differences (p≤0.05) between WT and KO after ozone-exposure are indicated by asterisks (*) and connecting bars. All other pair-wise comparisons are noted by connecting bars with the p value for each comparison shown under each connecting bar.

Similar articles

Cited by

References

    1. Alcorn JF, Wright JR. Surfactant protein A inhibits alveolar macrophage cytokine production by CD14-independent pathway. Am J Physiol Lung Cell Mol Physiol. 2004;286:L129–L136. - PubMed
    1. Allen MJ, Harbeck R, Smith B, Voelker DR, Mason RJ. Binding of rat and human surfactant proteins A and D to Aspergillus fumigatus conidia. Infect.Immun. 1999;67:4563–4569. - PMC - PubMed
    1. Atochina EN, Beck JM, Preston AM, Haczku A, Tomer Y, Scanlon ST, Fusaro T, Casey J, Hawgood S, Gow AJ, Beers MF. Enhanced lung injury and delayed clearance of Pneumocystis carinii in surfactant protein A-deficient mice: attenuation of cytokine responses and reactive oxygen-nitrogen species. Infect.Immun. 2004;72:6002–6011. - PMC - PubMed
    1. Baker MA, Cerniglia GJ, Zaman A. Microtiter plate assay for the measurement of glutathione and glutathione disulfide in large numbers of biological samples. Analytical Biochemistry. 1990;190:360–365. - PubMed
    1. Behndig AF, Mudway IS, Brown JL, Stenfors N, Helleday R, Duggan ST, Wilson SJ, Boman C, Cassee FR, Frew AJ, Kelly FJ, Sandstrom T, Blomberg A. Airway antioxidant and inflammatory responses to diesel exhaust exposure in healthy humans. Eur.Respir.J. 2006;27:359–365. - PubMed

Publication types