Virus-specific T cell responses in macaques acutely infected with SHIV(sf162p3)
- PMID: 17307212
- PMCID: PMC1959567
- DOI: 10.1016/j.virol.2007.01.010
Virus-specific T cell responses in macaques acutely infected with SHIV(sf162p3)
Abstract
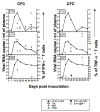
CD4(+) T helper and CD8(+) cytotoxic T lymphocyte responses are believed to play an important role in the control of primary HIV and SIV infection. However, the role of these cells in macaques acutely infected with SHIV(sf162p3) has not been well characterized. In this study, ten adult rhesus macaques were intravaginally infected with SHIV(sf162p3), and antigen-specific cytokine responses to SHIV-Tat, Nef, Gag and Env peptide pools were examined through 70 days post inoculation (p.i.) using ELISPOT and/or cytokine flow cytometry (CFC). Peak plasma viral replication occurred between 14 and 21 days p.i. followed by low to undetectable plasma viremia by 70 days of infection in most macaques. Although some animals had strong virus-specific cellular immune responses, many had weak or minimal responses that did not correlate with the post peak decline in plasma viremia.
Figures


Similar articles
-
SHIV-C109p5 NHP induces rapid disease progression in elderly macaques with extensive GI viral replication.J Virol. 2024 Feb 20;98(2):e0165223. doi: 10.1128/jvi.01652-23. Epub 2024 Feb 1. J Virol. 2024. PMID: 38299866 Free PMC article.
-
Profound early control of highly pathogenic SIV by an effector memory T-cell vaccine.Nature. 2011 May 26;473(7348):523-7. doi: 10.1038/nature10003. Epub 2011 May 11. Nature. 2011. PMID: 21562493 Free PMC article.
-
SMAC Mimetic Plus Triple-Combination Bispecific HIVxCD3 Retargeting Molecules in SHIV.C.CH505-Infected, Antiretroviral Therapy-Suppressed Rhesus Macaques.J Virol. 2020 Oct 14;94(21):e00793-20. doi: 10.1128/JVI.00793-20. Print 2020 Oct 14. J Virol. 2020. PMID: 32817214 Free PMC article.
-
V3 loop-determined coreceptor preference dictates the dynamics of CD4+-T-cell loss in simian-human immunodeficiency virus-infected macaques.J Virol. 2005 Oct;79(19):12296-303. doi: 10.1128/JVI.79.19.12296-12303.2005. J Virol. 2005. PMID: 16160156 Free PMC article.
-
Emergence of simian immunodeficiency virus-specific cytotoxic CD4+ T cells and increased humoral responses correlate with control of rebounding viremia in CD8-depleted macaques infected with Rev-independent live-attenuated simian immunodeficiency virus.J Immunol. 2010 Sep 15;185(6):3348-58. doi: 10.4049/jimmunol.1000572. Epub 2010 Aug 11. J Immunol. 2010. PMID: 20702730 Free PMC article.
Cited by
-
Recombinant vesicular stomatitis virus-based west Nile vaccine elicits strong humoral and cellular immune responses and protects mice against lethal challenge with the virulent west Nile virus strain LSU-AR01.Vaccine. 2009 Feb 5;27(6):893-903. doi: 10.1016/j.vaccine.2008.11.087. Epub 2008 Dec 12. Vaccine. 2009. PMID: 19070640 Free PMC article.
-
SIV infection of rhesus macaques of Chinese origin: a suitable model for HIV infection in humans.Retrovirology. 2013 Aug 15;10:89. doi: 10.1186/1742-4690-10-89. Retrovirology. 2013. PMID: 23947613 Free PMC article. Review.
-
Reduced inflammation and CD4 loss in acute SHIV infection during oral pre-exposure prophylaxis.J Infect Dis. 2012 Sep 1;206(5):770-9. doi: 10.1093/infdis/jis422. Epub 2012 Jun 27. J Infect Dis. 2012. PMID: 22740713 Free PMC article.
-
Immune perturbation following SHIV infection is greater in newborn macaques than in infants.JCI Insight. 2024 Aug 27;9(19):e144448. doi: 10.1172/jci.insight.144448. JCI Insight. 2024. PMID: 39190496 Free PMC article.
-
Recombinant Simian Varicella Virus-Simian Immunodeficiency Virus Vaccine Induces T and B Cell Functions and Provides Partial Protection against Repeated Mucosal SIV Challenges in Rhesus Macaques.Viruses. 2022 Dec 17;14(12):2819. doi: 10.3390/v14122819. Viruses. 2022. PMID: 36560823 Free PMC article.
References
-
- Addo MM, Yu XG, Rathod A, Cohen D, Eldridge RL, Strick D, Johnston MN, Corcoran C, Wurcel AG, Fitzpatrick CA, Feeney ME, Rodriguez WR, Basgoz N, Draenert R, Stone DR, Brander C, Goulder PJ, Rosenberg ES, Altfeld M, Walker BD. Comprehensive epitope analysis of human immunodeficiency virus type 1 (HIV-1)-specific T-cell responses directed against the entire expressed HIV-1 genome demonstrate broadly directed responses, but no correlation to viral load. J Virol. 2003;77(3):2081–92. - PMC - PubMed
-
- Batten CJ, De Rose R, Wilson KM, Agy MB, Chea S, Stratov I, Montefiori DC, Kent SJ. Comparative evaluation of simian, simian-human, and human immunodeficiency virus infections in the pigtail macaque (Macaca nemestrina) model. AIDS Res Hum Retroviruses. 2006;22(6):580–8. - PubMed
-
- Belyakov IM, Kuznetsov VA, Kelsall B, Klinman D, Moniuszko M, Lemon M, Markham PD, Pal R, Clements JD, Lewis MG, Strober W, Franchini G, Berzofsky JA. Impact of vaccine-induced mucosal high-avidity CD8+ CTLs in delay of AIDS viral dissemination from mucosa. Blood. 2006;107(8):3258–64. - PMC - PubMed
-
- Betts MR, Krowka JF, Kepler TB, Davidian M, Christopherson C, Kwok S, Louie L, Eron J, Sheppard H, Frelinger JA. Human immunodeficiency virus type 1-specific cytotoxic T lymphocyte activity is inversely correlated with HIV type 1 viral load in HIV type 1-infected long-term survivors. AIDS Research & Human Retroviruses. 1999;15(13):1219–28. - PubMed
Publication types
MeSH terms
Substances
Grants and funding
- AI49080/AI/NIAID NIH HHS/United States
- RR012112/RR/NCRR NIH HHS/United States
- G20 RR019628/RR/NCRR NIH HHS/United States
- AI051649/AI/NIAID NIH HHS/United States
- S10 RR016963/RR/NCRR NIH HHS/United States
- P51 RR000164/RR/NCRR NIH HHS/United States
- P51 OD011104/OD/NIH HHS/United States
- RR013466/RR/NCRR NIH HHS/United States
- G20 RR018397/RR/NCRR NIH HHS/United States
- AI065413/AI/NIAID NIH HHS/United States
- R01 AI049080/AI/NIAID NIH HHS/United States
- U19 AI065413/AI/NIAID NIH HHS/United States
- G20 RR013466/RR/NCRR NIH HHS/United States
- RR019628/RR/NCRR NIH HHS/United States
- P01 AI051649/AI/NIAID NIH HHS/United States
- G20 RR016930/RR/NCRR NIH HHS/United States
- RR016930/RR/NCRR NIH HHS/United States
- RR018397/RR/NCRR NIH HHS/United States
- RR00164/RR/NCRR NIH HHS/United States
LinkOut - more resources
Full Text Sources
Other Literature Sources
Medical
Research Materials

