Determination of key aspects of precursor cell proliferation, cell cycle length and kinetics in the adult mouse subgranular zone
- PMID: 17307295
- PMCID: PMC2230096
- DOI: 10.1016/j.neuroscience.2006.12.064
Determination of key aspects of precursor cell proliferation, cell cycle length and kinetics in the adult mouse subgranular zone
Abstract
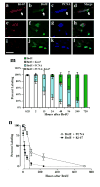
Neurogenesis studies on the adult mouse hippocampal subgranular zone (SGZ) typically report increases or decreases in proliferation. However, key information is lacking about these proliferating SGZ precursors, from the fundamental--what dose of bromodeoxyuridine (BrdU) is appropriate for labeling all S phase cells?--to the detailed--what are the kinetics of BrdU-labeled cells and their progeny? To address these questions, adult C57BL/6J mice were injected with BrdU and BrdU-immunoreactive (IR) cells were quantified. Initial experiments with a range of BrdU doses (25-500 mg/kg) suggested that 150 mg/kg labels all actively dividing precursors in the mouse SGZ. Experiments using a saturating dose of BrdU suggested BrdU bioavailability is less than 15 min, notably shorter than in the developing mouse brain. We next explored precursor division and maturation by tracking the number of BrdU-IR cells and colabeling of BrdU with other cell cycle proteins from 15 min to 30 days after BrdU. We found that BrdU and the Gap2 and mitosis (G2/M) phase protein pHisH3 maximally colocalized 8 h after BrdU, indicating that the mouse SGZ precursor cell cycle length is 14 h. In addition, triple labeling with BrdU and proliferating cell nuclear antigen (PCNA) and Ki-67 showed that BrdU-IR precursors and/or their progeny express these endogenous cell cycle proteins up to 4 days after BrdU injection. However, the proportion of BrdU/Ki-67-IR cells declined at a greater rate than the proportion of BrdU/PCNA-IR cells. This suggests that PCNA protein is detectable long after cell cycle exit, and that reliance on PCNA may overestimate the length of time a cell remains in the cell cycle. These findings will be critical for future studies examining the regulation of SGZ precursor kinetics in adult mice, and hopefully will encourage the field to move beyond counting BrdU-IR cells to a more mechanistic analysis of adult neurogenesis.
Figures


Similar articles
-
Chronic morphine induces premature mitosis of proliferating cells in the adult mouse subgranular zone.J Neurosci Res. 2004 Jun 15;76(6):783-94. doi: 10.1002/jnr.20090. J Neurosci Res. 2004. PMID: 15160390
-
Time course of morphine's effects on adult hippocampal subgranular zone reveals preferential inhibition of cells in S phase of the cell cycle and a subpopulation of immature neurons.Neuroscience. 2008 Nov 11;157(1):70-9. doi: 10.1016/j.neuroscience.2008.08.064. Epub 2008 Sep 9. Neuroscience. 2008. PMID: 18832014 Free PMC article.
-
Short-term sleep deprivation may alter the dynamics of hippocampal cell proliferation in adult rats.Neuroscience. 2010 Nov 10;170(4):1140-52. doi: 10.1016/j.neuroscience.2010.08.018. Epub 2010 Aug 18. Neuroscience. 2010. PMID: 20727388
-
Adult neurogenesis: can analysis of cell cycle proteins move us "Beyond BrdU"?Curr Pharm Biotechnol. 2007 Jun;8(3):147-65. doi: 10.2174/138920107780906540. Curr Pharm Biotechnol. 2007. PMID: 17584088 Review.
-
Quantification of epithelial cell proliferation, cell dynamics, and cell kinetics in vivo.Wiley Interdiscip Rev Dev Biol. 2017 Jul;6(4). doi: 10.1002/wdev.274. Epub 2017 May 5. Wiley Interdiscip Rev Dev Biol. 2017. PMID: 28474479 Review.
Cited by
-
Aging Modulates the Ability of Quiescent Radial Glia-Like Stem Cells in the Hippocampal Dentate Gyrus to be Recruited into Division by Pro-neurogenic Stimuli.Mol Neurobiol. 2024 Jun;61(6):3461-3476. doi: 10.1007/s12035-023-03746-5. Epub 2023 Nov 23. Mol Neurobiol. 2024. PMID: 37995077
-
Permanent impairment of birth and survival of cortical and hippocampal proliferating cells following excessive drinking during alcohol dependence.Neurobiol Dis. 2009 Oct;36(1):1-10. doi: 10.1016/j.nbd.2009.05.021. Epub 2009 Jun 6. Neurobiol Dis. 2009. PMID: 19501165 Free PMC article.
-
Microglia shape adult hippocampal neurogenesis through apoptosis-coupled phagocytosis.Cell Stem Cell. 2010 Oct 8;7(4):483-95. doi: 10.1016/j.stem.2010.08.014. Cell Stem Cell. 2010. PMID: 20887954 Free PMC article.
-
Btg1 is Required to Maintain the Pool of Stem and Progenitor Cells of the Dentate Gyrus and Subventricular Zone.Front Neurosci. 2012 Aug 30;6:124. doi: 10.3389/fnins.2012.00124. eCollection 2012. Front Neurosci. 2012. PMID: 22969701 Free PMC article.
-
A single-day treatment with mifepristone is sufficient to normalize chronic glucocorticoid induced suppression of hippocampal cell proliferation.PLoS One. 2012;7(9):e46224. doi: 10.1371/journal.pone.0046224. Epub 2012 Sep 25. PLoS One. 2012. PMID: 23049985 Free PMC article.
References
-
- Abrous DN, Koehl M, Le Moal M. Adult neurogenesis: from precursors to network and physiology. Physiol Rev. 2005;85:523–569. - PubMed
-
- Alexiades MR, Cepko C. Quantitative analysis of proliferation and cell cycle length during development of the rat retina. Dev Dyn. 1996;205:293–307. - PubMed
-
- Alvarez-Buylla A, Lim DA. For the long run: maintaining germinal niches in the adult brain. Neuron. 2004;41:683–686. - PubMed
-
- Amaral D, Witter M. The Rat Nervous System San Diego. Academic Press; 1995. Hippocampal Formation; pp. 443–493.
-
- Bacchi CE, Gown AM. Detection of cell proliferation in tissue sections. Braz J Med Biol Res. 1993;26:677–687. - PubMed
Publication types
MeSH terms
Substances
Grants and funding
LinkOut - more resources
Full Text Sources
Miscellaneous

