. 2007 Apr;13(4):563-72.
doi: 10.1261/rna.457207. Epub 2007 Feb 16.

Global analysis of alternative splicing during T-cell activation

Affiliations

Global analysis of alternative splicing during T-cell activation

Joanna Y Ip et al. RNA. 2007 Apr.

Abstract

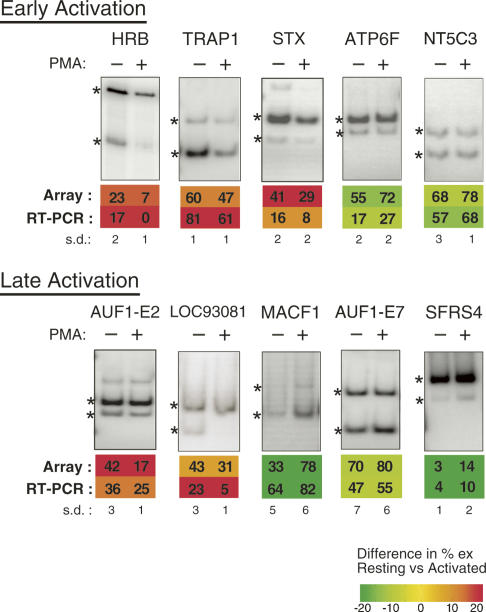
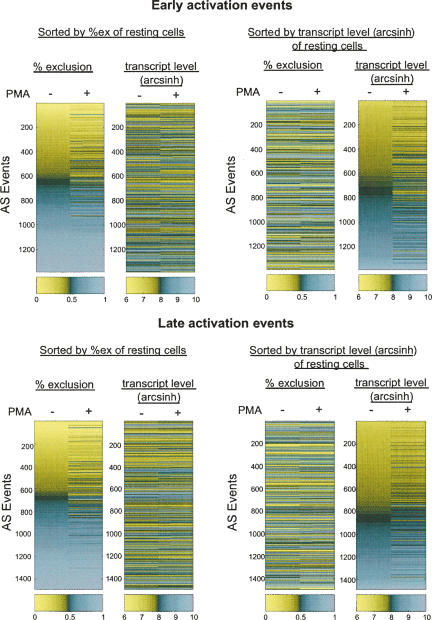
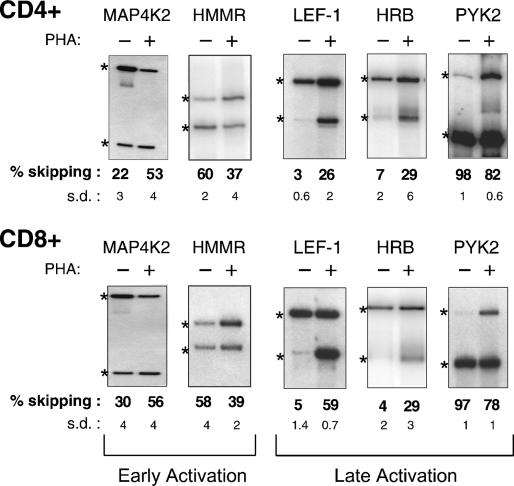
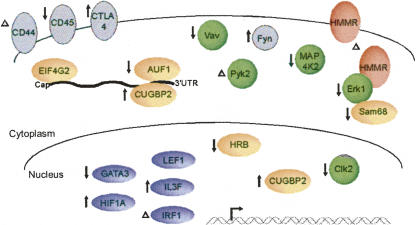
The role of alternative splicing (AS) in eliciting immune responses is poorly understood. We used quantitative AS microarray profiling to survey changes in AS during activation of Jurkat cells, a leukemia-derived T-cell line. Our results indicate that approximately 10-15% of the profiled alternative exons undergo a >10% change in inclusion level during activation. The majority of the genes displaying differential AS levels are distinct from the set of genes displaying differential transcript levels. These two gene sets also have overlapping yet distinct functional roles. For example, genes that show differential AS patterns during T-cell activation are often closely associated with cell-cycle regulation, whereas genes with differential transcript levels are highly enriched in functions associated more directly with immune defense and cytoskeletal architecture. Previously unknown AS events were detected in genes that have important roles in T-cell activation, and these AS level changes were also observed during the activation of normal human peripheral CD4+ and CD8+ lymphocytes. In summary, by using AS microarray profiling, we have discovered many new AS changes associated with T-cell activation. Our results suggest an extensive role for AS in the regulation of the mammalian immune response.


Figures

FIGURE 1.
FIGURE 1.
Analysis of isoform expression in Jurkat cells of genes predicted by microarray to undergo changes in alternative splicing (AS) upon stimulation. Representative RT-PCR assays performed using Jurkat RNA isolated at either early or late time points after treatment with PMA, as described in Materials and Methods. Quantification of %ex and standard deviation (s.d.) from three independent experiments are shown, along with the corresponding prediction from the AS microarray profiling data. Numbers given indicate %exon skipping (i.e., exclusion). Asterisks indicate RT-PCR products derived from exon included and exon skipped isoforms.
FIGURE 2.
FIGURE 2.
Different subsets of genes are regulated at the AS and transcript levels during Jurkat cell activation. The %ex values and transcript level following treatment with PMA for 7 h (early activation) or 60 h (late activation) are plotted. In the left panel, AS events are sorted according to the %ex values in the resting state from low to high exclusion, and the corresponding transcript levels for the same genes are shown in the adjacent column. In the right panel, events are sorted according to transcript levels in the resting state from low to high expression, and the %ex levels of the AS events in the same genes are shown in the adjacent column.
FIGURE 3.
FIGURE 3.
Analysis of isoform expression in human CD4+ and CD8+ cells of genes predicted to undergo changes in AS upon stimulation. Representative RT-PCR assays performed using RNA isolated from CD4+ or CD8+ cells at either early or late time points after treatment with PHA, as described in Materials and Methods. Quantification and standard deviation (s.d.) from three to four experiments is shown. Numbers given indicate %exon skipping (i.e., exclusion). Asterisks indicate RT-PCR products derived from exon included and exon skipped isoforms.
FIGURE 4.
FIGURE 4.
Model for the functions of AS during activation of human T cells. Schematic diagram of proteins affected by AS in T cells, as predicted by AS microarray profiling and confirmed by RT-PCR analysis of RNA from human CD4+ or CD8+ cells, and the predicted consequences. Color coding of proteins is as follows: green for kinases and signal adaptor molecules, orange for proteins involved in RNA metabolism, blue for transcription factors, pink for receptors, and gray for proteins shown in previous studies to be regulated by AS in T cells. The location of each proteins is shown according to its known functional role. These classifications are not precise as some proteins fit into more than one functional category and others are known to function in more than one location in the cell. Up and down arrows and Δ, respectively, indicate putative increase, decrease, or altered function of a protein as a consequence of AS upon T cell activation. See Supplemental Table 5 for further information.

References

    1. Abraham, R.T., Weiss, A. Jurkat T cells and development of the T-cell receptor signalling paradigm. Nat. Rev. Immunol. 2004;4:301–308. - PubMed
    1. Beissbarth, T., Speed, T.P. GOstat: Find statistically overrepresented gene ontologies within a group of genes. Bioinformatics. 2004;20:1464–1465. - PubMed
    1. Blencowe, B.J. Alternative splicing: New insights from global analyses. Cell. 2006;126:37–47. - PubMed
    1. Farrar, J.D., Ouyang, W., Lohning, M., Assenmacher, M., Radbruch, A., Kanagawa, O., Murphy, K.M. An instructive component in T helper cell type 2 (Th2) development mediated by GATA-3. J. Exp. Med. 2001;193:643–650. - PMC - PubMed
    1. Georgopoulos, K., Winandy, S., Avitahl, N. The role of the Ikaros gene in lymphocyte development and homeostasis. Annu. Rev. Immunol. 1997;15:155–176. - PubMed

Publication types

MeSH terms