. 2007 Apr 15;92(8):L67-9.
doi: 10.1529/biophysj.107.104497. Epub 2007 Feb 16.

Two-color far-field fluorescence nanoscopy

Two-color far-field fluorescence nanoscopy

Gerald Donnert et al. Biophys J. .

Abstract

We demonstrate two-color fluorescence microscopy with nanoscale spatial resolution by applying stimulated emission depletion on fluorophores differing in their absorption and emission spectra. Green- and red-emitting fluorophores are selectively excited and quenched using dedicated beam pairs. The stimulated emission depletion beams deliver a lateral resolution of <30 nm and 65 nm for the green and the red color channel, respectively. The approximately 5 nm alignment accuracy of the two images establishes the precision with which differently labeled proteins are correlated in space. Colocalized nanoscopy is demonstrated with endosomal protein patterns and by resolving nanoclusters of a mitochondrial outer membrane protein, Tom20, in relation with the F(1)F(0)ATP synthase. The joint improvement of resolution and colocalization demonstrates the emerging potential of far-field fluorescence nanoscopy to study the spatial organization of macromolecules in cells.


Figures
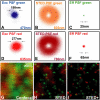
FIGURE 1
FIGURE 1
Two-color STED microscopy. Excitation and STED PSFs for the green (A and B) and the red (D and E) fluorescence channel. C and F give an upper bound for the effective PSF of the STED microscope under the conditions applied; note the 7.9× and 4.3× reduction in full-width at half-maximum as compared to the excitation spot. Randomly dispersed green and red fluorescent beads exemplify the resolution gain: confocal (G), STED plain data (H), and STED plus a Richardson-Lucy deconvolution (I). Deconvolution slightly further improved the resolution.
FIGURE 2
FIGURE 2
Synaptic proteins synaptotagmin I (red) and synaptophysin (green) on endosomes. (A and C) Confocal references and (B and D) STED images (both linearly deconvolved) revealing ring-shaped synaptophysin domains, whereas synaptotagmin I mainly forms dotted structures. We added double-labeled fluorescence beads to the sample, which were not resolved in the confocal image but in the corresponding STED image (arrows in D, green look-up table adjusted for the beads relative to the rest of the image). Dual-color beads allowed for a colocalization precision of ∼5 nm. (E) Colocalization profiles of proteins (along white dotted line in D). Scale bar, 100 nm.
FIGURE 3
FIGURE 3
Mitochondria labeled with antibodies specific for the F1F0ATP synthase (red) and the TOM complex (green). Unlike the confocal (A), the STED image (B) reveals nanoscale protein distribution patterns; in both images the raw data were further enhanced by a linear deconvolution (LD). The TOM complex is located in distinct clusters (at the mitochondrial surface, green pattern in B). The visualization of the distribution of the F1F0ATP shows a homogeneous staining pattern (red in B). Scale bar, 200 nm.
FIGURE 4
FIGURE 4
Mitochondria with labeled F1F0ATP synthase (green) and TOM complex (red); reverted antibody labeling as compared to Fig. 3. Again, the TOM complex appears as clusters; unlike the confocal (left), the STED recording (right) resolves the TOM complex clusters. In both recordings, the raw data were subject to a linear deconvolution (LD) with the respective PSF. (Inset) Low magnification image. Scale bar, 200 nm.

References

    1. Abbe, E. 1873. Beiträge zur Theorie des Mikroskops und der mikroskopischen Wahrnehmung. Arch. f. Mikr. Anat. 9:413–420.
    1. Hell, S. W., and J. Wichmann. 1994. Breaking the diffraction resolution limit by stimulated emission: stimulated emission depletion microscopy. Opt. Lett. 19:780–782. - PubMed
    1. Hell, S. W. 2003. Toward fluorescence nanoscopy. Nat. Biotechnol. 21:1347–1355. - PubMed
    1. Westphal, V., and S. W. Hell. 2005. Nanoscale resolution in the focal plane of an optical microscope. Phys. Rev. Lett. 94:143903. - PubMed
    1. Donnert, G., J. Keller, R. Medda, M. A. Andrei, S. O. Rizzoli, R. Lührmann, R. Jahn, C. Eggeling, and S. W. Hell. 2006. Macromolecular-scale resolution in biological fluorescence microscopy. Proc. Natl. Acad. Sci. USA. 103:11440–11445. - PMC - PubMed

MeSH terms

Substances