

Light scattering from collagen fiber networks: micro-optical properties of normal and neoplastic stroma
- PMID: 17307834
- PMCID: PMC1852360
- DOI: 10.1529/biophysj.106.089839
Light scattering from collagen fiber networks: micro-optical properties of normal and neoplastic stroma
Abstract
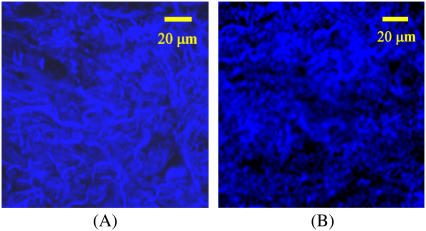
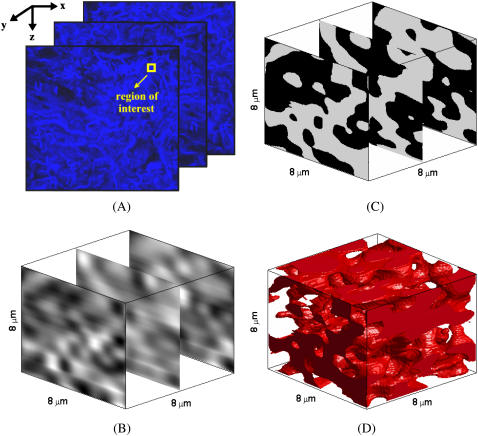
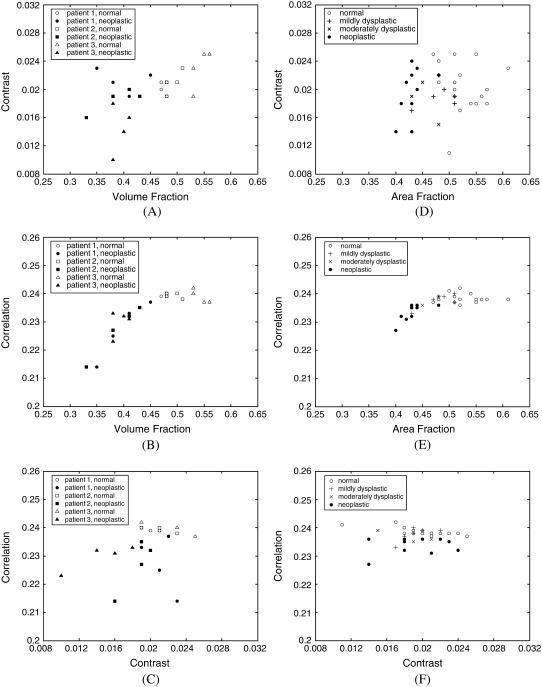
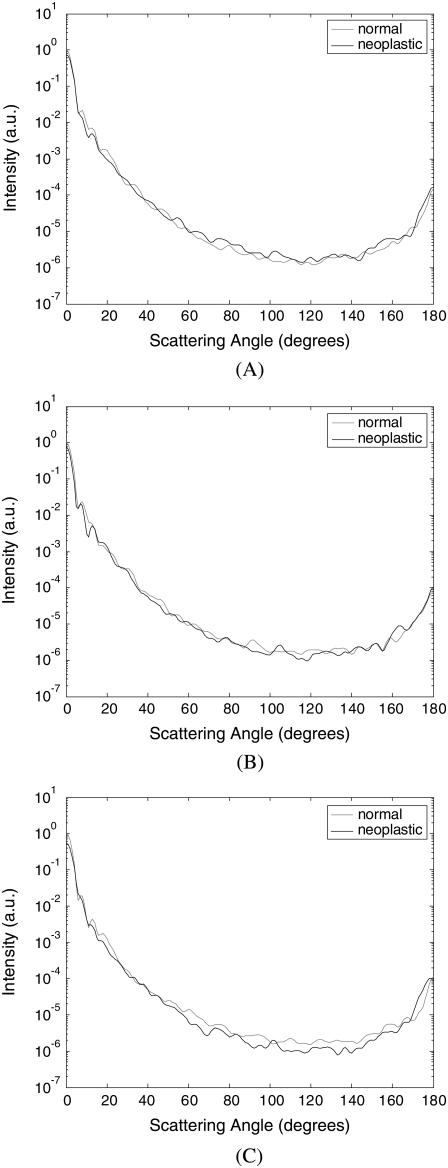
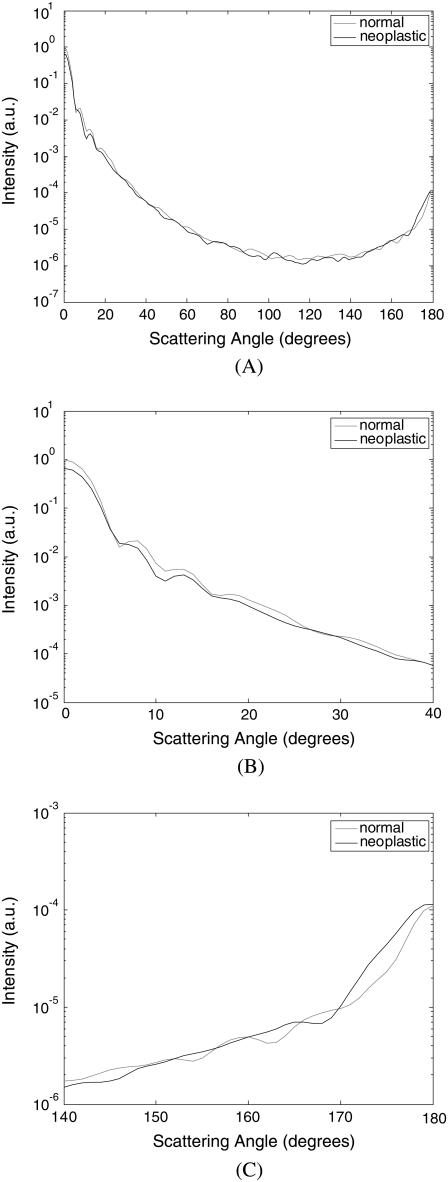
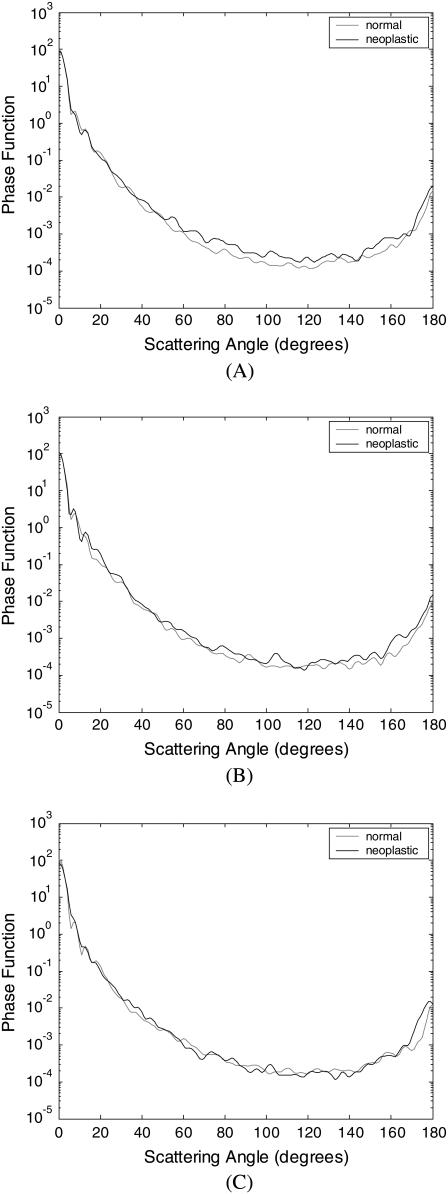
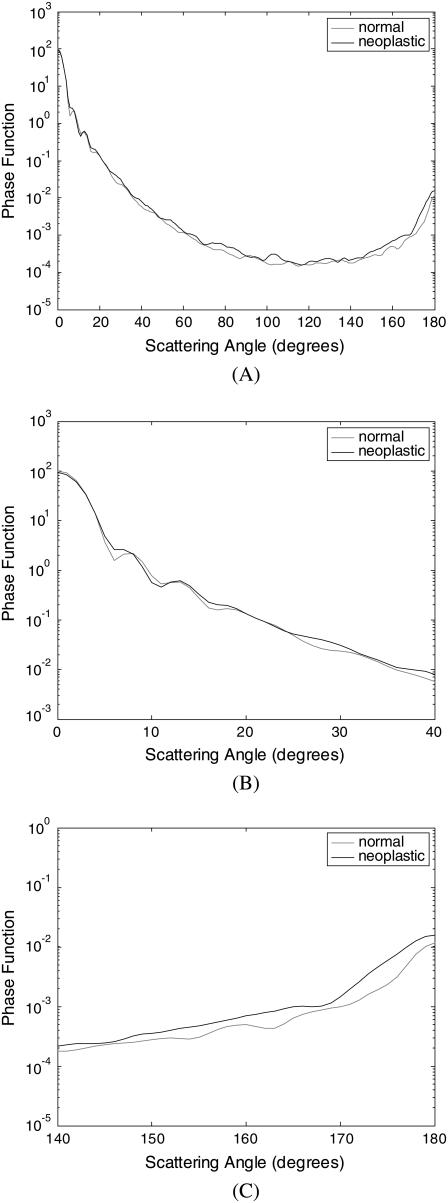
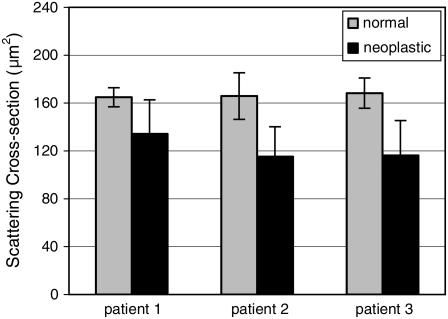
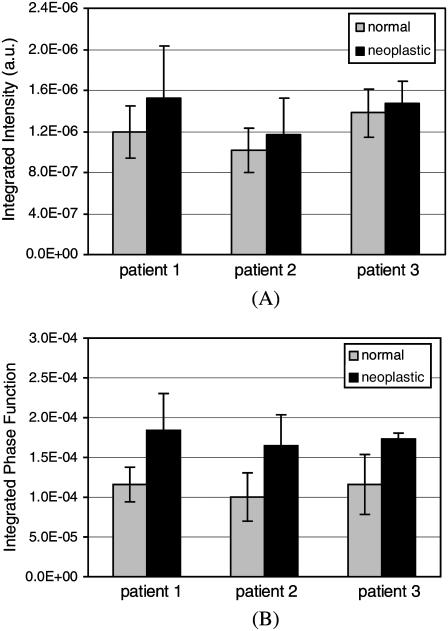
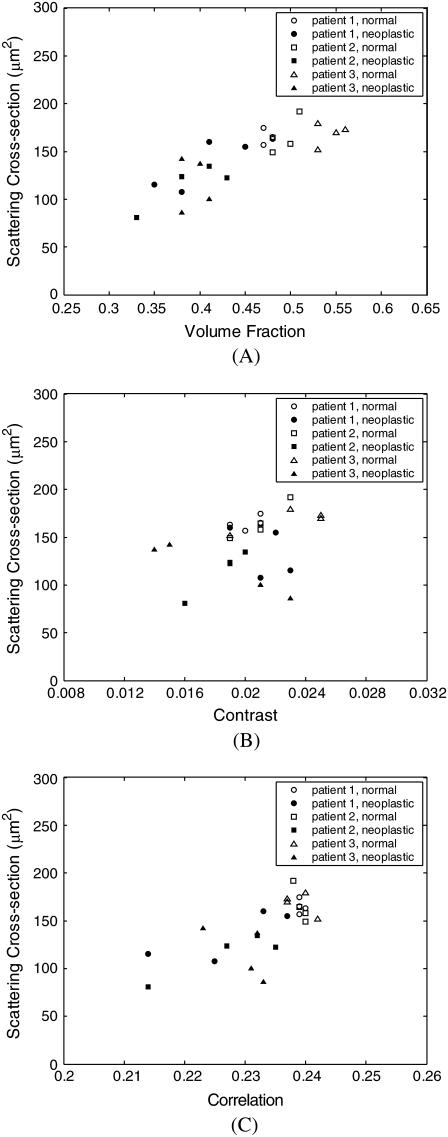
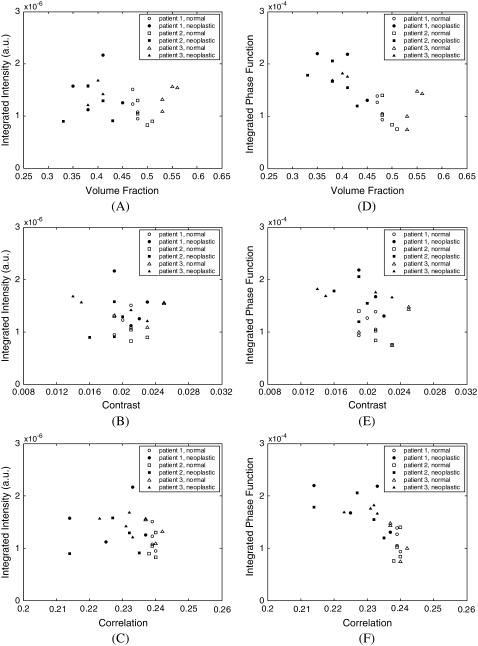
Development of epithelial precancer and cancer leads to well-documented molecular and structural changes in the epithelium. Recently, it has been recognized that stromal biology is also altered significantly with preinvasive disease. We used the finite-difference time-domain method, a popular technique in computational electromagnetics, to model light scattering from heterogeneous collagen fiber networks and to analyze how neoplastic changes alter stromal scattering properties. Three-dimensional optical images from the stroma of fresh normal and neoplastic oral-cavity biopsies were acquired using fluorescence confocal microscopy. These optical sections were then processed to create realistic three-dimensional collagen networks as model input. Image analysis revealed that the volume fraction of collagen fibers in the stroma decreases with precancer and cancer progression, and fibers tend to be shorter and more disconnected in neoplastic stroma. The finite-difference time-domain modeling results showed that neoplastic fiber networks have smaller scattering cross sections compared to normal networks. Computed scattering-phase functions indicate that high-angle scattering probabilities tend to be higher for neoplastic networks. These results provide valuable insight into the micro-optical properties of normal and neoplastic stroma. Characterization of optical signals obtained from epithelial tissues can aid in development of optical spectroscopic and imaging techniques for noninvasive monitoring of early neoplastic changes.
Figures
References
-
- Jemal, A., R. Siegel, E. Ward, T. Murray, J. Xu, C. Smigal, and M. J. Thun. 2006. Cancer statistics, 2006. CA Cancer J. Clin. 56:106–130. - PubMed
-
- American Cancer Society. 2006. Cancer Facts and Figures 2006. American Cancer Society, Atlanta.
-
- Koss, L. G. 1992. Diagnostic Cytology and Its Histopathologic Bases. Lippincott, Philadelphia.
-
- Mueller, M. M., and N. E. Fusenig. 2002. Tumor-stroma interactions directing phenotype and progression of epithelial skin tumor cells. Differentiation. 70:486–497. - PubMed
-
- Pupa, S. M., S. Menard, S. Forti, and E. Tagliabue. 2002. New insights into the role of extracellular matrix during tumor onset and progression. J. Cell. Physiol. 192:259–267. - PubMed
Publication types
MeSH terms
Substances
Grants and funding
LinkOut - more resources
Full Text Sources
Other Literature Sources
Medical
