Comparative Study
. 2007 Feb 27;104(9):3538-43.
doi: 10.1073/pnas.0606870104. Epub 2007 Feb 16.

Moonlight shifts the endogenous clock of Drosophila melanogaster

Affiliations
Comparative Study

Moonlight shifts the endogenous clock of Drosophila melanogaster

Wolfgang Bachleitner et al. Proc Natl Acad Sci U S A. .

Abstract

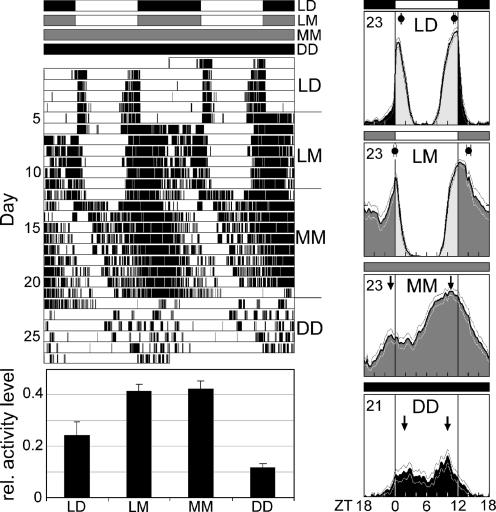
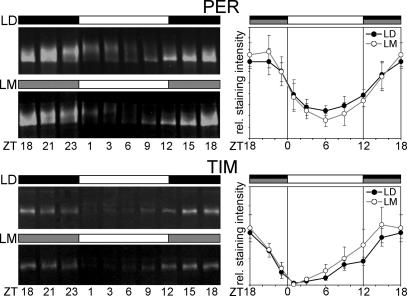
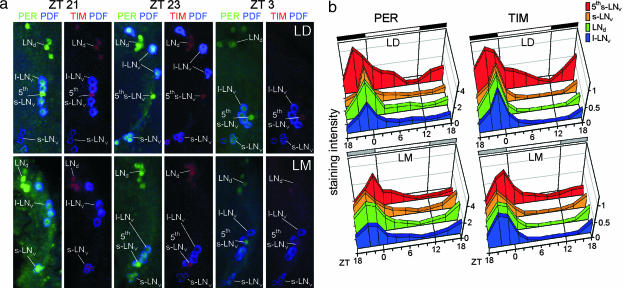
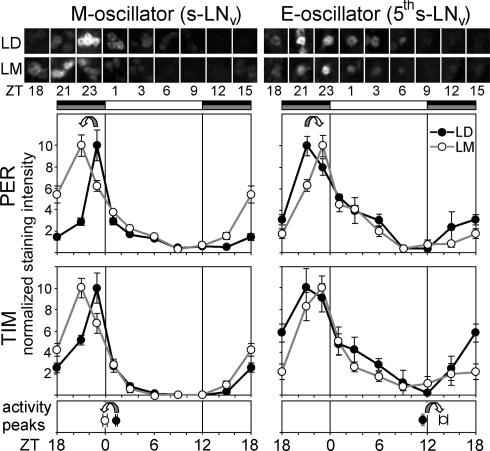
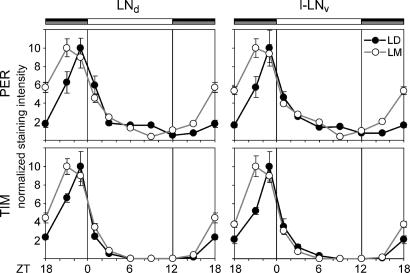
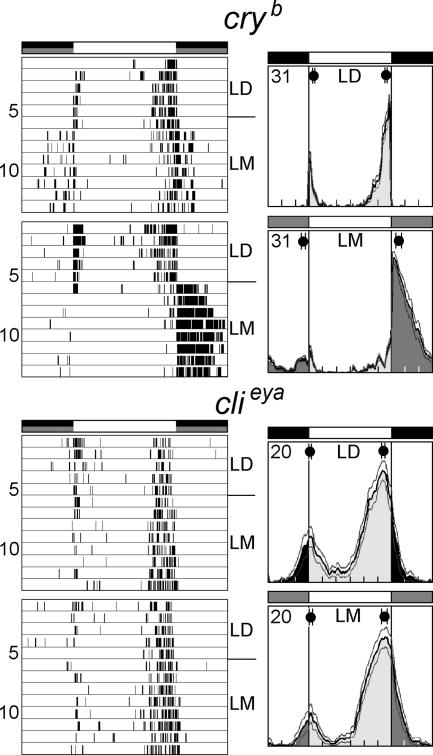
The ability to be synchronized by light-dark cycles is a fundamental property of circadian clocks. Although there are indications that circadian clocks are extremely light-sensitive and that they can be set by the low irradiances that occur at dawn and dusk, this has not been shown on the cellular level. Here, we demonstrate that a subset of Drosophila's pacemaker neurons responds to nocturnal dim light. At a nighttime illumination comparable to quarter-moonlight intensity, the flies increase activity levels and shift their typical morning and evening activity peaks into the night. In parallel, clock protein levels are reduced, and clock protein rhythms shift in opposed direction in subsets of the previously identified morning and evening pacemaker cells. No effect was observed on the peripheral clock in the eye. Our results demonstrate that the neurons driving rhythmic behavior are extremely light-sensitive and capable of shifting activity in response to the very low light intensities that regularly occur in nature. This sensitivity may be instrumental in adaptation to different photoperiods, as was proposed by the morning and evening oscillator model of Pittendrigh and Daan. We also show that this adaptation depends on retinal input but is independent of cryptochrome.


Conflict of interest statement

The authors declare no conflict of interest.

Figures

Fig. 1.
Fig. 1.
Wild-type flies and the photoreceptor mutants cryb and clieya are able to synchronize to dim light. Eleven wild-type, 23 cryb, and 12 clieya flies were recorded for 10 days under LD cycles with a light intensity of 0.03 lux during the light phase. A typical actogram is shown for each genotype. Periodogram analysis revealed that all tested flies synchronized to the 24-h cycle [mean periods: 24.0 ± 0.02 h (wild-type); 24.0 ± 0.02 h (cryb); and 24.0 ± 0.03 h (clieya)].
Fig. 2.
Fig. 2.
Activity patterns of wild-type flies recorded consecutively under LD cycles, LM cycles, MM, and DD. (Left) Double-plotted actogram of the locomotor behavior of an individual fly and the mean activity levels of all flies. (Right) Average activity profiles under LD, LM, MM, and DD of all 23 recorded flies. Under LD cycles, activity occurs in M and E, respectively. Under LM cycles, the M activity peak advances by 1.0 h (±0.2 h), whereas the E activity peak delays by 3.0 h (±0.2 h), making the fly nocturnal. The dots on top of the LD and LM profiles indicate the average time of M and E peaks (±SEM) calculated from the peak points of individual flies. Periodogram analysis revealed that all flies synchronized to LD and LM, showing mean periods of 24.0 ± 0.01 h and 24.0 ± 0.02 h, respectively. Under MM conditions, the flies free-ran, maintaining a large M–E interval (arrows). This interval was considerably smaller under DD conditions (arrows). Periods were not significantly different under MM (24.8 ± 0.1 h) and DD (24.7 ± 0.2 h), but activity levels were significantly higher under MM. This applies also for LM and LD. The error bars are SEMs.
Fig. 3.
Fig. 3.
Photoreceptor cells of wild-type flies show similar PER and TIM oscillations under LD and LM conditions. (Left) Western blots of whole-head extracts stained with anti-PER or anti-TIM. (Right) Mean staining intensity calculated for PER and TIM under LD and LM conditions for three independent blots, respectively. No significant differences occurred between LD and LM. The error bars are SEMs.
Fig. 4.
Fig. 4.
Moonlight induces temporal changes in PER and TIM immunoreactivity in the pacemaker neurons of wild-type flies. (a) PER and TIM staining in the different groups of lateral neurons under LD and LM conditions at ZT21, ZT23, and ZT3. PER is visualized in green, TIM in red, and PDF in blue. PDF labeling is essential for identifying the fifth s-LNv cell, which is located among the l-LNv cells but which lacks PDF. (b) Quantification of the staining results. The fifth s-LNv cell is maximally labeled at ZT21 under LD but at ZT23 under LM conditions. The s-LNv cells show the strongest labeling at ZT23 under LD but at ZT21 under LM conditions. As for the s-LNv cells, the l-LNv and LNd cells show the strongest labeling at ZT23 under LD and at ZT21 under LM conditions, but their peak becomes broader under LM and the phase advance appears less pronounced.
Fig. 5.
Fig. 5.
The molecular shift in the M (s-LNv) and E (fifth s-LNv) cells corresponds to the shift in activity peaks. (Left) M oscillator represented by the s-LNv. (Right) E oscillator represented by the fifth s-LNv. (Top) Representative stainings for PER. (Middle) LD and LM curves for PER and TIM. (Bottom) Phases of the M and E activity peaks of wild-type flies under LD and LM. Staining intensities for PER and TIM were normalized (maximal staining intensity set to 10) to better compare the peak points. Significant staining differences between LD and LM were found in the M cells at ZT18, ZT21, and ZT23 for PER and at ZT18 and ZT21 for TIM (P < 0.05). In the E cells, staining was significantly different at ZT21 for PER and ZT18 for TIM (P < 0.05). The M activity peak occurs immediately after the drop in PER and TIM levels in the M cells; M activity and protein peaks are both advanced under LM. The E activity peak occurs ≈14 h after peak levels in the fifth s-LNv; E activity and protein peaks are both delayed under LM. The error bars are SEMs.
Fig. 6.
Fig. 6.
The LNd and l-LNv cells respond as M oscillators. Significant staining differences between LD and LM were found in the LNd and l-LNv cells at ZT18 and ZT21 for PER and TIM (P < 0.05). Labeling is the same as in Fig. 5.
Fig. 7.
Fig. 7.
Typical actograms of cryb and clieya mutants and average activity profiles under LD and LM conditions. The cryb fly shown in the topmost actogram was recorded under LM of 0.03 lux; all other flies were recorded under LM of 0.5 lux. The average activity profiles were calculated from flies recorded under LM of 0.5 lux. Periodogram analysis revealed 24-h rhythms for all flies under all conditions, showing that they synchronized to LD and LM (0.03 and 0.5 lux). cryb mutants shifted their activity peaks in a similar manner, as did wild-type flies, but clieya mutants did not respond at all to nocturnal moonlight. Labeling is the same as in Fig. 2.

References

    1. Pittendrigh CS. Cold Spring Harb Symp Quant Biol. 1960;25:159–184. - PubMed
    1. Bünning E. Planta. 1969;86:209–217. - PubMed
    1. Erkert HG, Gburek V, Scheideler A. Physiol Behav. 2006;88:39–46. - PubMed
    1. Erkert HG, Gröber J. Folia Primatol (Basel) 1986;47:171–188. - PubMed
    1. Kappeler P, Erkert H. Behav Ecol Sociobiol. 2003;54:359–369.

Publication types

LinkOut - more resources