. 2007 Apr;143(4):1615-27.
doi: 10.1104/pp.106.094953. Epub 2007 Feb 16.

Multiple roles of ADP-ribosylation factor 1 in plant cells include spatially regulated recruitment of coatomer and elements of the Golgi matrix

Affiliations

Multiple roles of ADP-ribosylation factor 1 in plant cells include spatially regulated recruitment of coatomer and elements of the Golgi matrix

Loren A Matheson et al. Plant Physiol. 2007 Apr.

Abstract

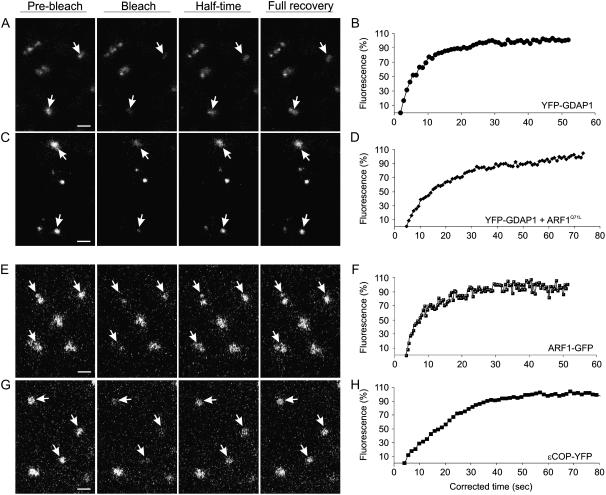
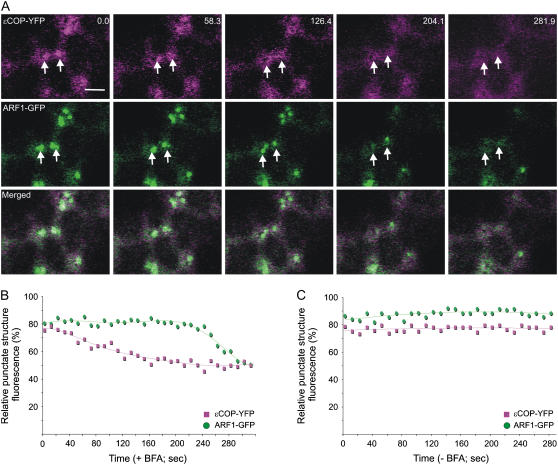
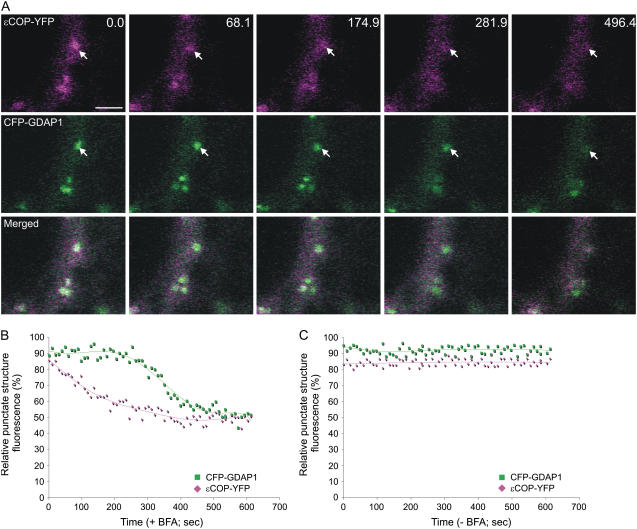
Recent evidence indicates that ADP-ribosylation factor 1 (ARF1) carries out multiple roles in plant cells that may be independent from the established effector complex COPI. To investigate potential COPI-independent functions, we have followed the dynamics of ARF1 and a novel putative effector, the plant golgin GRIP-related ARF-binding domain-containing Arabidopsis (Arabidopsis thaliana) protein 1 (GDAP1) in living plant cells. We present data that ascribe a new role to ARF1 in plant cell membrane traffic by showing that the GTPase functions to recruit GDAP1 to membranes. In addition, although ARF1 appears to be central to the recruitment of both COPI components and the golgin, we have established a different subcellular distribution of these ARF1 effectors. Live cell imaging demonstrates that GDAP1 and COPI are distributed on Golgi membranes. However, GDAP1 is also found on ARF1-labeled structures that lack coatomer, suggesting that the membrane environment, rather than ARF1 alone, influences the differential recruitment of ARF1 effectors. In support of this hypothesis, fluorescence recovery after photobleaching analyses demonstrated that GDAP1 and COPI have different kinetics on membranes during the cycle of activation and inactivation of ARF1. Therefore, our data support a model where modulation of the cellular functions of ARF1 in plant cells encompasses not only the intrinsic activities of the effectors, but also differential recruitment onto membranes that is spatially regulated.


Figures

Figure 1.
Figure 1.
The subcellular distribution of GDAP1 overlaps that of ARF1. A, Images from a time-lapse sequence of confocal images of tobacco leaf epidermal cells expressing YFP-GDAP1. Time(s) of frame acquisition is indicated at the top right corner. The arrows indicate motile structures labeled by YFP-GDAP1. Scale bar = 5 μm. B, High magnification image of YFP-GDAP1 demonstrating large ring structures. Scale bar = 2 μm. C, Confocal images of YFP-GDAP1 coexpressed with the ER/Golgi marker ERD2-GFP. GDAP1 is localized at Golgi bodies and at additional structures (arrowhead; inset in E, merged image of C and D). YFP-GDAP1 (F) colocalized with all structures labeled by ARF1-GFP (G). H, Merged image of F and G. Inset shows detail of H. Scale bars in C and F = 5 μm.
Figure 2.
Figure 2.
Coexpression of active ARF1 and GDAP1 enhances the recruitment of the golgin onto the Golgi apparatus. A, Confocal images of the YFP channel only of cells expressing either YFP-GDAP1 alone or YFP-GDAP1 with untagged ARF1Q71L, which mimics the active form of ARF1 (Teal et al., 1994; Pimpl et al., 2000). The presence of untagged ARF1 in cells was ensured by using a double cistronic vector encoding ARF1Q71L and the peroxisomal marker, CFP-SKL (Stefano et al., 2006a). Fluorescence quantification was carried out in cells where both the YFP and CFP signals were present. Scale bar = 5 μm. B, The fluorescence of the punctate structures relative to that of the cytosol was quantified for YFP-GDAP1 alone or coexpressed with ARF1Q71L. The RPSF is given as a percentage of the ratio between fluorescence intensity values (arbitrary units) measured in the cytosol and the sum of intensity values for the cytosol and punctate structures (see “Materials and Methods”). We found that the intensity of punctate structure fluorescence increased significantly when YFP-GDAP1 was coexpressed with ARF1Q71L (P < 0.05). Error bars represent sds for 75 measurements over 45 different cells. C, Confocal images of cells expressing either ɛCOP-YFP alone or with untagged ARF1Q71L (YFP channel only) encoded in an ARF1Q71L-CFPSKL double cistronic vector, as described in A and B, above. D, Quantification of the RPSF fluorescence shows that in the presence of ARF1Q71L, the signal of ɛCOP-YFP increases on the Golgi membranes (P < 0.05). Error bars represent sds for 65 measurements over 30 different cells.
Figure 3.
Figure 3.
BFA treatment induces the simultaneous redistribution of YFP-GDAP1 and ARF1-GFP. A, Time-lapse confocal micrographs demonstrate the effect of BFA treatment on a live tobacco epidermal cell coexpressing YFP-GDAP1 and ARF1-GFP. The distribution of both markers was clearly visible on punctate structures before BFA treatment. Representative images are shown at various time points throughout the BFA treatment. There was variability observed in the response rate of ARF1-labeled structures within a given cell. In addition, temporal inconsistencies in response to BFA treatment were also observed between cells, in agreement with the observations of Ritzenthaler et al. (2002). However, the trend always remained consistent in that both ARF1 and GDAP1 were simultaneously released into the cytosol from the same structures. The time(s) is indicated in the top right corner. The first image in the sequence (labeled 0.0) was taken after a 45-min pretreatment with latrunculin B and a subsequent incubation of 5 min with BFA. Scale bar = 2 μm. The fluorescence of the punctate structures relative to that of the cytosol was measured for both YFP-GDAP1 and ARF1-GFP in each frame of the time lapse with (B) and without (C) BFA treatment. The RPSF is given as a percentage of the ratio between fluorescence intensity values (arbitrary units) measured in the punctate structure and the sum of intensity values for the cytosol and punctate structure (see “Materials and Methods”).
Figure 4.
Figure 4.
ARF1Q71L is capable of a direct interaction with GDAP1. A, Interaction of recombinant His6-tagged ARF1 wild type (ARF1wt) and mutants with GST-GDAP1 in vitro. Lanes 1 to 3, An immunoblot with a His6 antibody on a 10% fraction of each E. coli extract was performed to test whether comparable amounts of ARF1wt-His6 (lane 1), ARF1Q71L-His6 (lane 2), and ARF1T31N-His6 (lane 3) were loaded onto the columns. Lane 4, negative control, extract from E. coli expressing His6-tag alone. Lanes 5 to 12, a short exposure of an immunoblot with anti-His6 serum on column eluates demonstrates that there was retention of ARF1wt-His6 (lane 5) as well as ARF1Q71L-His6 (lane 6) by GST-GDAP1. There was no detectable signal of ARF1T31N-His6 at this exposure length (lane 7). Negative controls, His6 alone (lane 8). There was no retention of the His6-tagged ARF proteins (lanes 9–11) or the His6 tag alone (lane 12) by GST alone. Lanes 13 to 20, a longer exposure of the same membrane demonstrates that there is in fact a low affinity for ARF1T31N by GDAP1 (lane 15). GST-GDAP1 preferentially retains ARF1wt-His6 (lane 13) and ARF1Q71L-His6 (lane 14). The negative controls (lanes 16–20) were as described above for lanes 8 to 11. Lanes 21 to 24, immunoblot with anti-GST serum on column eluates demonstrates that GST-GDAP1 and GST were present on the columns in similar quantities. Therefore, any differences in the retention of ARF1 or its mutants were due to differences in the affinity of GDAP1 for the interaction. B, In vitro interaction of GST-GDAP1 with recombinant ARF1wt-His6 charged with nucleotides. This experiment was performed and presented as in A, with the exception of using ARF1wt-His6 coupled with either GTPγS or GDPβS in place of ARF1Q71L-His6 and ARF1T31N-His6, respectively. These results confirmed the observations (A) showing that ARF1 does interact with GDAP1 directly, and the inactive form of ARF1 has a decreased affinity for the golgin.
Figure 5.
Figure 5.
The membrane cycling kinetics of ARF1 effectors are different. Results of qualitative FRAP experiments on a cortical section of tobacco leaf epidermal cells expressing GDAP1-YFP (A), coexpressing YFP-GDAP1 and ARF1Q71L-CFPSKL (C; Stefano et al., 2006a), ARF1-GFP (E), and ɛCOP-YFP (G). Samples were treated with latrunculin B to stop movement of Golgi and additional non-Golgi fluorescent structures. Each image in the horizontal sequence represents a prebleach, bleach, half-time recovery, or full recovery event, as indicated. Arrows indicate punctate structures that were bleached. Note that the smaller punctate structures of ARF1 recover with the same half time as Golgi-localized ARF1 (E). Scale bars = 2 μm. Half-time recovery curves of the fluorescence in cells expressing YFP-GDAP1 (B; 8.25 ± 0.25 s, n = 15), YFP-GDAP1 + ARF1Q71L-CFPSKL (D; 16.13 ± 0.91 s, n = 12), ARF1-GFP (F; 7.71 ± 0.91 s, n = 12), and ɛCOP-YFP (H; 19.85 ± 0.25 s, n = 10) are also shown. Half time is defined as the time required for the fluorescence in the photobleached region to recover to 50% of the recovery asymptote, and n represents the number of bleached Golgi stacks.
Figure 6.
Figure 6.
ɛCOP is more sensitive to BFA treatment than is ARF1. A, Time-lapse confocal micrographs demonstrate the effect of BFA treatment on a live tobacco epidermal cell coexpressing ɛCOP-YFP and ARF1-GFP. Representative images are shown with the time(s) indicated in the top right corner. The first image in the sequence (labeled 0.0) was taken after a 45-min pretreatment with latrunculin B and a subsequent incubation of 5 min with BFA. The images show that ɛCOP-YFP fluorescence is released from the Golgi (arrow) prior to the release of ARF1-GFP in the cytosol. Scale bar = 5 μm. The fluorescence of the punctate structures relative to that of the cytosol was measured for both ARF1-GFP and ɛCOP-YFP in each frame of the time lapse with (B) and without (C) BFA treatment. The RPSF is given as a percentage of the ratio between fluorescence intensity values (arbitrary units) measured in the punctate structure and the sum of intensity values for the cytosol and punctate structure (see “Materials and Methods”).
Figure 7.
Figure 7.
ARF1 effectors demonstrate different sensitivities to BFA. A, Time-lapse confocal micrographs demonstrate the effect of BFA treatment on a live tobacco epidermal cell coexpressing YFP-GDAP1 and ɛCOP-YFP. Representative images are shown with the time in seconds indicated in the top right corner. The first image in the sequence (labeled 0.0) was taken after a 45-min pretreatment with latrunculin B and a subsequent incubation of 3.5 min with BFA. The images indicate that ɛCOP-YFP fluorescence is released from the Golgi, whereas CFP-GDAP1 remains on punctate structures. Scale bar = 5 μm. The fluorescence of the Golgi relative to that of the cytosol was measured for both GDAP1-CFP and ɛCOP-YFP in each frame of the time lapse with (B) and without (C) BFA treatment. The RPSF is given as a percentage of the ratio between fluorescence intensity values (arbitrary units) measured in the punctate structure and the sum of intensity values for the cytosol and punctate structure (see “Materials and Methods”).

Similar articles

Cited by

References

    1. Batoko H, Zheng HQ, Hawes C, Moore I (2000) A rab1 GTPase is required for transport between the endoplasmic reticulum and Golgi apparatus and for normal Golgi movement in plants. Plant Cell 12 2201–2218 - PMC - PubMed
    1. Boevink P, Oparka K, Santa Cruz S, Martin B, Betteridge A, Hawes C (1998) Stacks on tracks: the plant Golgi apparatus traffics on an actin/ER network. Plant J 15 441–447 - PubMed
    1. Bolte S, Talbot C, Boutte Y, Catrice O, Read ND, Satiat-Jeunemaitre B (2004) FM-dyes as experimental probes for dissecting vesicle trafficking in living plant cells. J Microsc 214 159–173 - PubMed
    1. Brandizzi F, Snapp EL, Roberts AG, Lippincott-Schwartz J, Hawes C (2002) Membrane protein transport between the endoplasmic reticulum and the Golgi in tobacco leaves is energy dependent but cytoskeleton independent: evidence from selective photobleaching. Plant Cell 14 1293–1309 - PMC - PubMed
    1. Contreras I, Ortiz-Zapater E, Aniento F (2004) Sorting signals in the cytosolic tail of membrane proteins involved in the interaction with plant ARF1 and coatomer. Plant J 38 685–698 - PubMed

Publication types

MeSH terms

Substances