. 2007 Feb;19(2):458-72.
doi: 10.1105/tpc.106.048934. Epub 2007 Feb 16.

Arabidopsis BRANCHED1 acts as an integrator of branching signals within axillary buds

Affiliations

Arabidopsis BRANCHED1 acts as an integrator of branching signals within axillary buds

José Antonio Aguilar-Martínez et al. Plant Cell. 2007 Feb.

Abstract

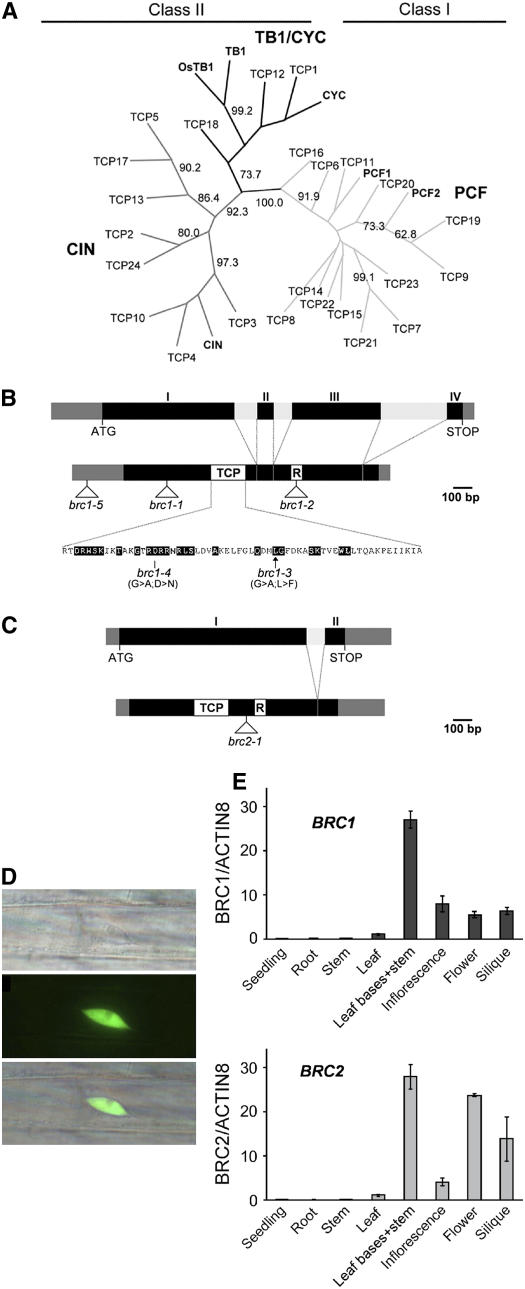
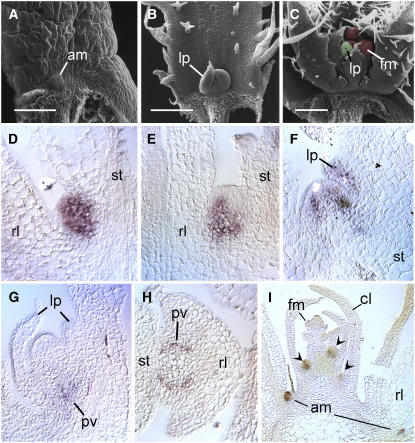
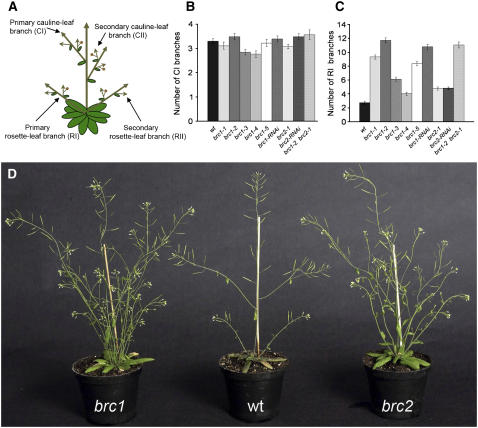
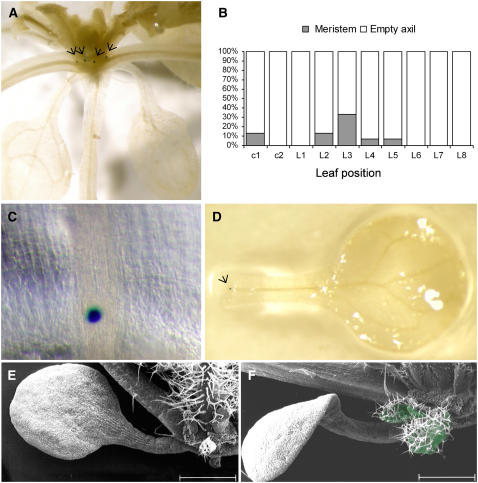
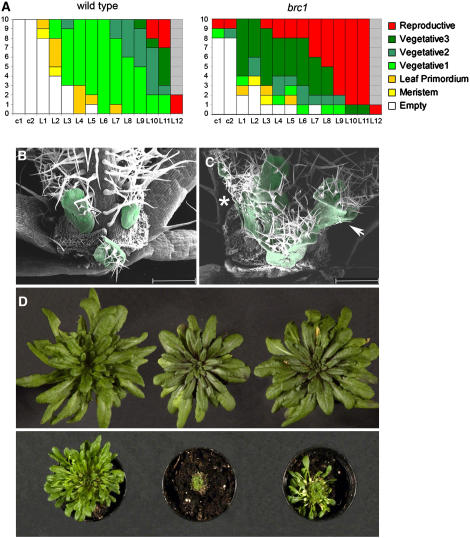
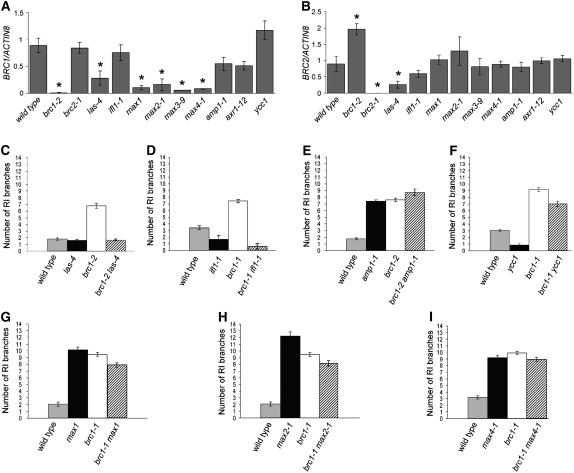
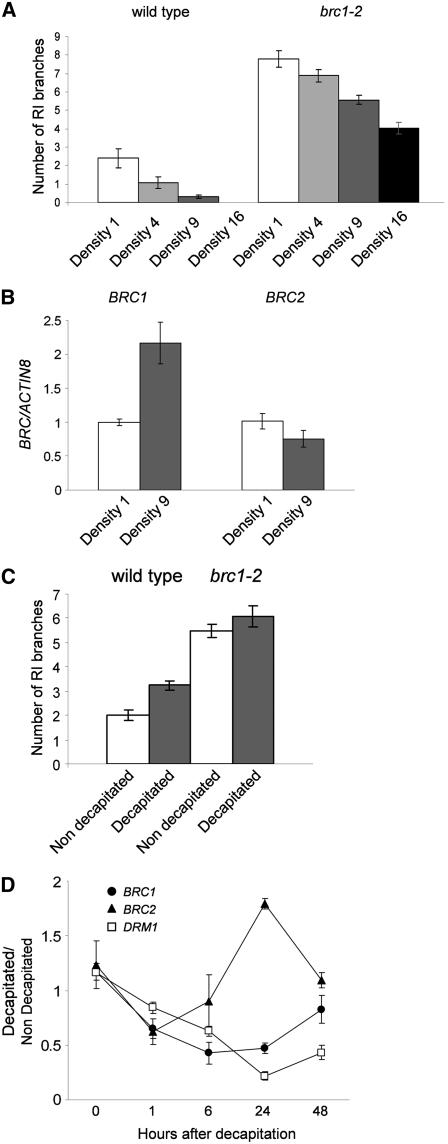
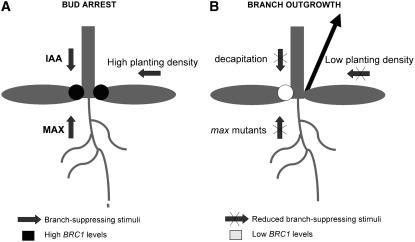
Shoot branching patterns depend on a key developmental decision: whether axillary buds grow out to give a branch or whether they remain dormant in the axils of leaves. This decision is controlled by endogenous and environmental stimuli mediated by hormonal signals. Although genes involved in the long-distance signaling of this process have been identified, the genes responding inside the buds to cause growth arrest remained unknown in Arabidopsis thaliana. Here, we describe an Arabidopsis gene encoding a TCP transcription factor closely related to teosinte branched1 (tb1) from maize (Zea mays), BRANCHED1 (BRC1), which represents a key point at which signals controlling branching are integrated within axillary buds. BRC1 is expressed in developing buds, where it arrests bud development. BRC1 downregulation leads to branch outgrowth. BRC1 responds to developmental and environmental stimuli controlling branching and mediates the response to these stimuli. Mutant and expression analyses suggest that BRC1 is downstream of the MORE AXILLARY GROWTH pathway and that it is required for auxin-induced apical dominance. Therefore, BRC1 acts inside the buds as an integrator of signals controlling bud outgrowth and translates them into a response of cell growth arrest. The conservation of BRC1/tb1 function among distantly related angiosperm species suggests that a single ancestral mechanism of branching control integration evolved before the radiation of flowering plants.


Figures

Figure 1.
Figure 1.
The BRC1 and BRC2 Gene Family, Structure, Transcripts, and Proteins. (A) Unrooted consensus tree showing relationships among the predicted Arabidopsis TCP proteins and members of other plant species, CYC, tb1, PCFs, and CIN. The percentage of bootstrap samples in which particular clades were monophyletic is indicated when it is 70% or more. Black lines represent the TB1/CYC clade, dark gray lines represent the CIN clade, and light gray lines represent the PCF clade. (B) and (C) Genomic and cDNA organization of BRC1 (B) and BRC2 (C). Black boxes represent exons, dark gray boxes represent 5′ and 3′ untranslated regions, light gray boxes represent introns, and white boxes represent conserved domains. Intron sizes were 116, 93, and 337 bp for introns 1, 2, and 3 of BRC1, respectively, and 95 bp for BRC2. Triangles indicate sites of T-DNA insertion in the mutants. brc1-5 is located 186 bp upstream of the ATG. Base pair changes resulting in changes in conserved residues of the TCP domain of brc1-3 and brc1-4 are indicated. Residues conserved in class II TCP proteins are represented by black boxes. (D) Nuclear localization of BRC1. Top, bright-field image of a transgenic Arabidopsis root cell expressing ProCaMV35S:GFP:BRC1. Center, UV light view of the same cell; GFP:BRC1 protein accumulates in the nucleus. Bottom, merged image of (A) and (B). Plants carrying nonfused GFP do not accumulate the protein in their nuclei (data not shown). (E) BRC1 (top) and BRC2 (bottom) mRNA levels in different tissues analyzed by real-time PCR. Error bars represent se from three biological replicates. The sample labeled Leaf bases+stem contains dissected rosette tissue highly enriched in axillary buds.
Figure 2.
Figure 2.
BRC Gene Expression during Bud Development. (A) Scanning electron microscopy image of an AM (meristem stage). (B) Scanning electron microscopy image of a bud of vegetative 1 stage. (C) Scanning electron microscopy image of a flowering bud (reproductive stage). Leaf primordia (green) and flower buds (red) are highlighted for clarity. (D) to (I) Sections of Arabidopsis rosettes hybridized with digoxigenin-labeled probes complementary to BRC1 ([D] to [G] and [I]) or BRC2 (H) transcripts. (D) Detail of an AM comparable to that shown in (A). (E) Detail of an AM beginning to initiate leaf primordia. (F) Bud of vegetative 1 stage similar to that shown in (B). (G) Reproductive stage bud similar to that shown in (C). (H) BRC2 mRNA accumulates in the developing vascular tissue of flowering buds. (I) General view of BRC1 mRNA distribution in a flowering rosette. (D) to (G) and (I) are longitudinal sections, and (H) is a transverse section. am, axillary meristem; cl, cauline leaf; fm, flower meristem; lp, leaf primordium; pv, provascular tissue; rl, rosette leaf; st, stem. Bars = 200 μm.
Figure 3.
Figure 3.
Shoot Branching Phenotype of brc Mutants. (A) Arabidopsis branching structure. (B) Number of primary cauline branches (CI). (C) Number of primary rosette branches (RI). For (B) and (C), one representative RNAi line for each gene was included. Error bars represent se (n = 26 to 27). (D) Shoot phenotype of mature brc1-2, wild-type Columbia, and brc2-1 plants.
Figure 4.
Figure 4.
AM Initiation in brc1 Mutants. (A) Flowering ProCLV3:GUS rosette stained to visualize GUS activity. Arrows indicate AMs. (B) Percentage of brc1-2 CLV3:GUS individuals with GUS-expressing AMs in different leaf positions at 15 d after germination (n = 16). All rosettes were vegetative. (C) Close-up of an AM expressing GUS. (D) AM in the axil of a cotyledon of a vegetative brc1-2 plant. (E) Empty axil of a wild-type cotyledon. (F) Bud (green) in the axil of a brc1-2 cotyledon. Bars in (E) and (F) = 1 mm.
Figure 5.
Figure 5.
Early Bud Development in brc Mutants. (A) Developmental stages of buds in the axils of cotyledons (c1 and c2) and rosette leaves (L1 to L12) of 10 wild-type (left) and brc1-2 (right) individuals. Developmental stages are defined in Methods: empty axil (white), meristem (yellow), leaf primordia (orange), vegetative 1 (light green), vegetative 2 (medium green), vegetative 3 (dark green), and reproductive (red). (B) Wild-type buds in the axils of the youngest rosette leaves (removed) in vegetative 2 stage. (C) brc1 buds in the axils of the youngest rosette leaves in vegetative 3 (arrow) and reproductive (asterisk) stages. In (B) and (C), the main shoot is <1 mm long, and axillary buds are highlighted in green for clarity. Bars = 500 μm. (D) Top, vegetative rosettes of plants grown for 50 short days viewed from above. From left to right, brc1-2, wild-type Columbia, and brc2-1. Bottom, the same plants after removing all of the rosette leaves to display the axillary bud leaves.
Figure 6.
Figure 6.
BRC Genes and Genetic Pathways of AM Development. BRC1 (A) and BRC2 (B) mRNA levels in different mutant backgrounds analyzed by real-time PCR. Error bars represent the se from three biological replicate experiments. Differences with respect to the wild type that were found to be significant in a Newman–Keuls test are indicated with asterisks. The other panels show the number of RI branches of double mutants of brc1 with las4 (C), ifl1 (D), amp1 (E), ycc1 (F), max1 (G), max2 (H), and max4 (I).
Figure 7.
Figure 7.
Response of BRC Genes to Branch-Suppressing or Branch-Promoting Stimuli. (A) Number of RI branches of wild-type and brc1-2 plants grown at different planting densities analyzed at 3 weeks after flowering. Density 1 indicates one plant/pot of 36 cm2; density 4 indicates four plants/pot; density 9 indicates nine plants/pot; and density 16 indicates 16 plants/pot. All pots were 6 cm deep. Flowering time was not affected. Error bars represent se (n = 10 to 42). (B) BRC1 and BRC2 mRNA levels analyzed by real-time PCR at density 9 related to levels at density 1. Error bars represent the se from three biological replicate experiments. (C) Number of RI branches of wild-type Columbia and brc1-2 plants at 10 d after removal of the main shoot. Error bars represent se (n = 14). Values were subjected to Student's t test. Wild-type differences were significant (P < 0.0003), whereas brc1-2 differences were not significant (P < 0.2782). (D) Ratio of mRNA levels between decapitated and nondecapitated plants of BRC1, BRC2, and DRM1, as analyzed by real-time PCR. Error bars represent the se from four biological replicate experiments.
Figure 8.
Figure 8.
Scheme of BRC1 Function in the Control of Bud Outgrowth. Under adverse conditions, branch-suppressing signals are transduced into the bud, resulting in the upregulation of BRC1 and bud arrest (A). In the absence of these signals, BRC1 is downregulated and shoots grow out (B). IAA, indole-3-acetic acid.

References

    1. Alonso, J.M., et al. (2003). Genome-wide insertional mutagenesis of Arabidopsis thaliana. Science 301 653–657. - PubMed
    1. Ausin, I., Alonso-Blanco, C., and Martinez-Zapater, J.M. (2005). Environmental regulation of flowering. Int. J. Dev. Biol. 49 689–705. - PubMed
    1. Bennett, T., Sieberer, T., Willett, B., Booker, J., Luschnig, C., and Leyser, O. (2006). The Arabidopsis MAX pathway controls shoot branching by regulating auxin transport. Curr. Biol. 16 553–563. - PubMed
    1. Beveridge, C.A. (2006). Axillary bud outgrowth: Sending a message. Curr. Opin. Plant Biol. 9 35–40. - PubMed
    1. Beveridge, C.A., Symons, G.M., and Turnbull, C.G.N. (2000). Auxin inhibition of decapitation-induced branching is dependent on graft-transmissible signals regulated by genes Rms1 and Rms2. Plant Physiol. 123 689–698. - PMC - PubMed

Publication types

MeSH terms

Associated data