. 2007 Feb;19(2):656-72.
doi: 10.1105/tpc.106.045351. Epub 2007 Feb 16.

Light-induced energy dissipation in iron-starved cyanobacteria: roles of OCP and IsiA proteins

Affiliations

Light-induced energy dissipation in iron-starved cyanobacteria: roles of OCP and IsiA proteins

Adjélé Wilson et al. Plant Cell. 2007 Feb.

Abstract

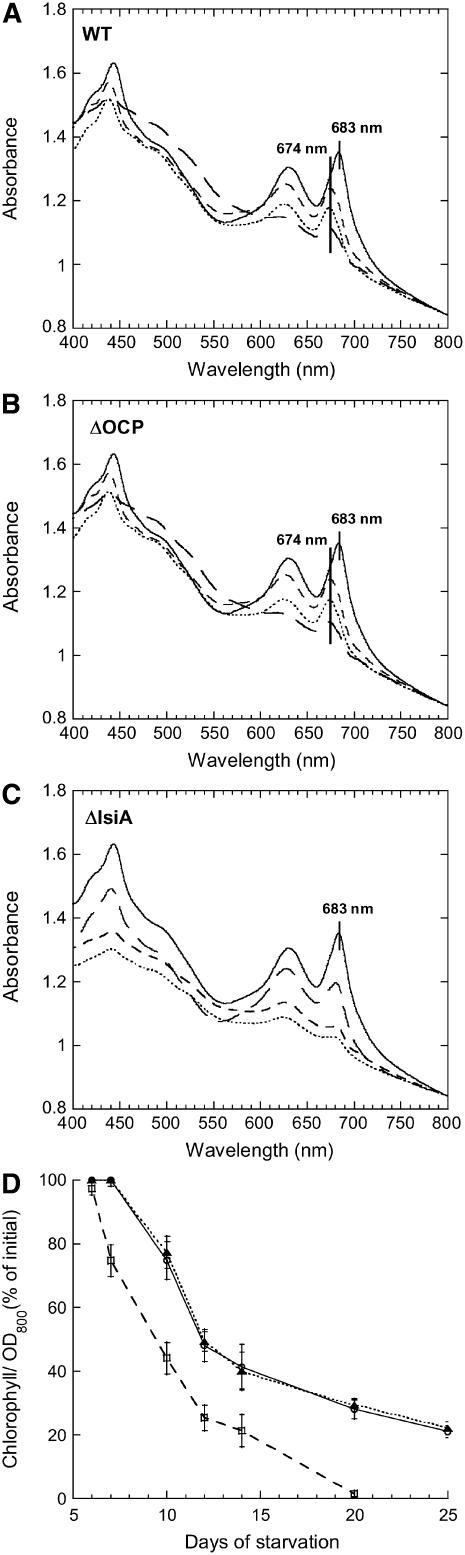
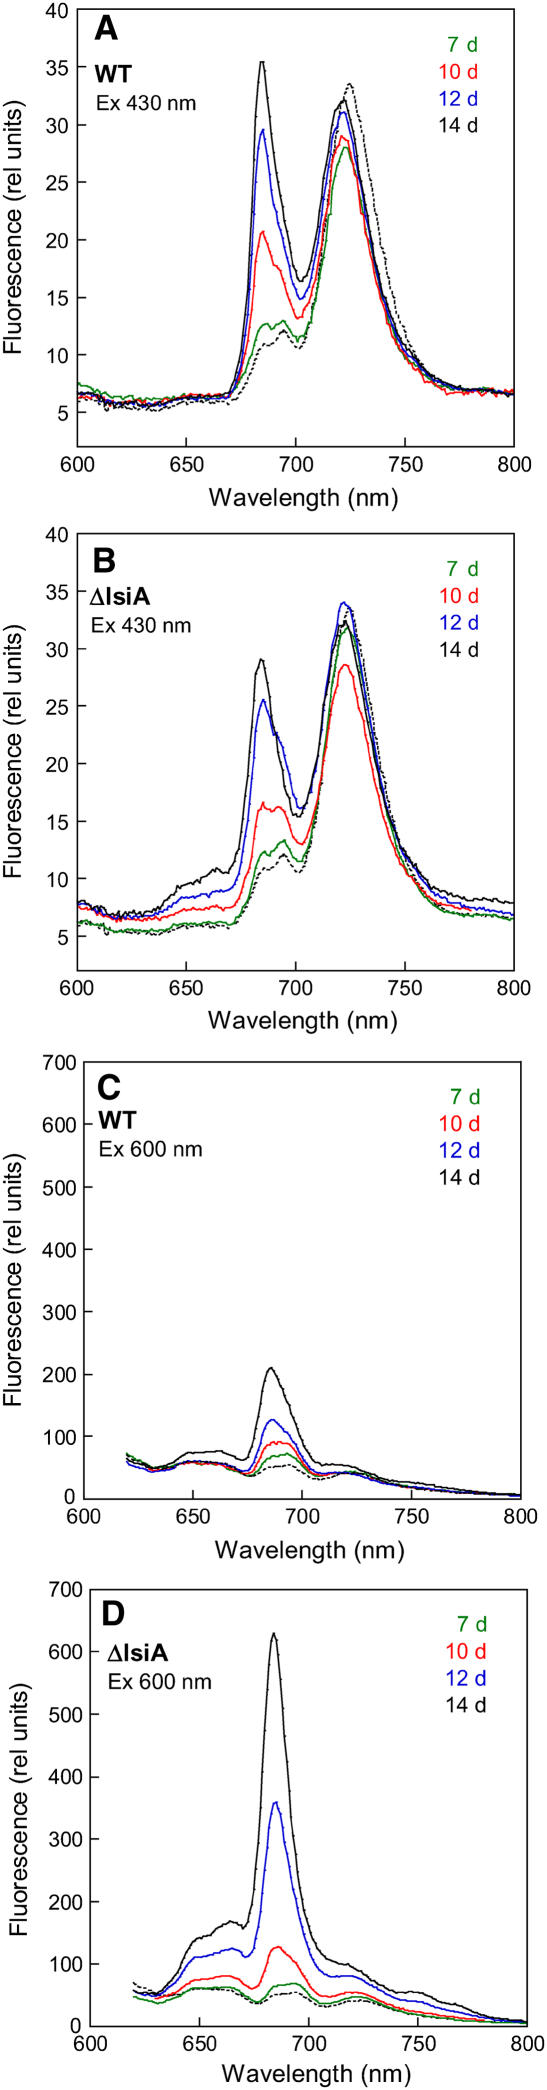
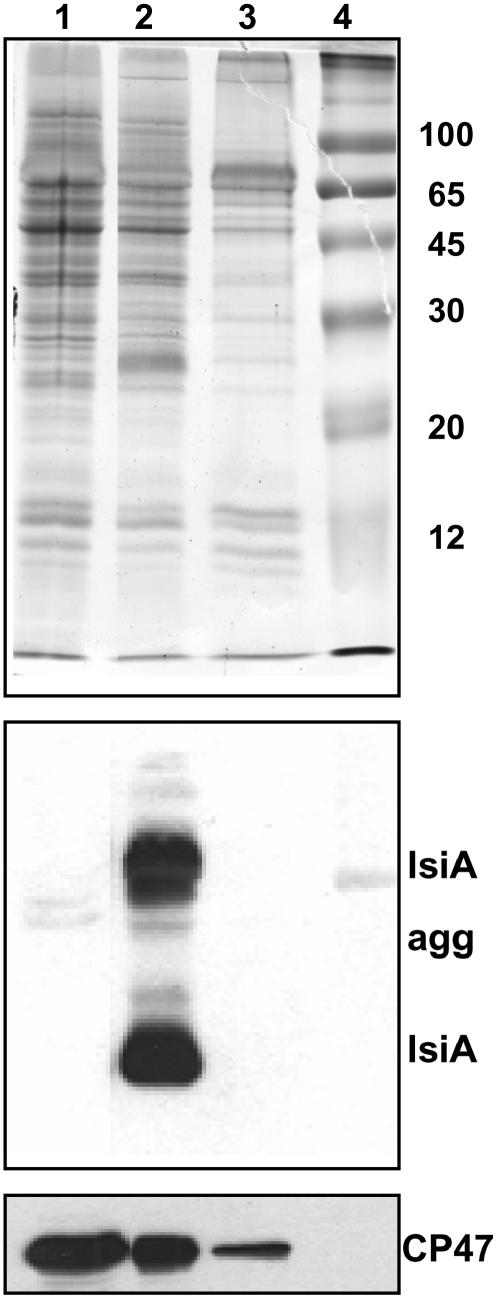
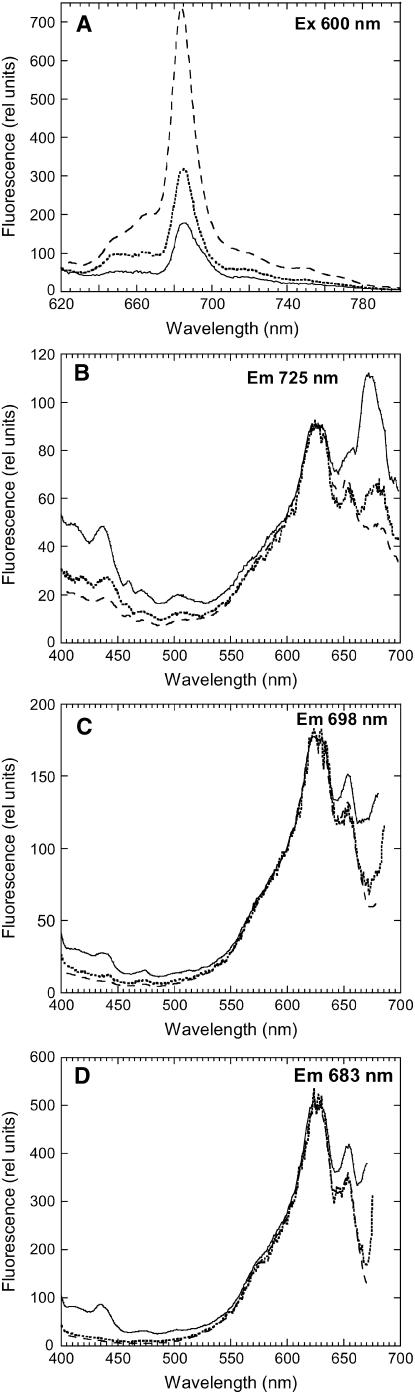
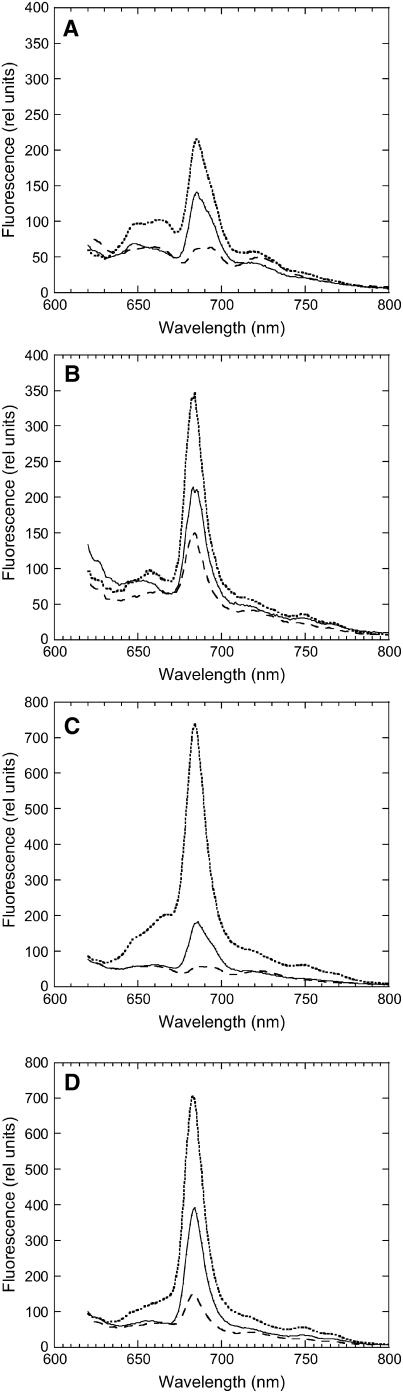
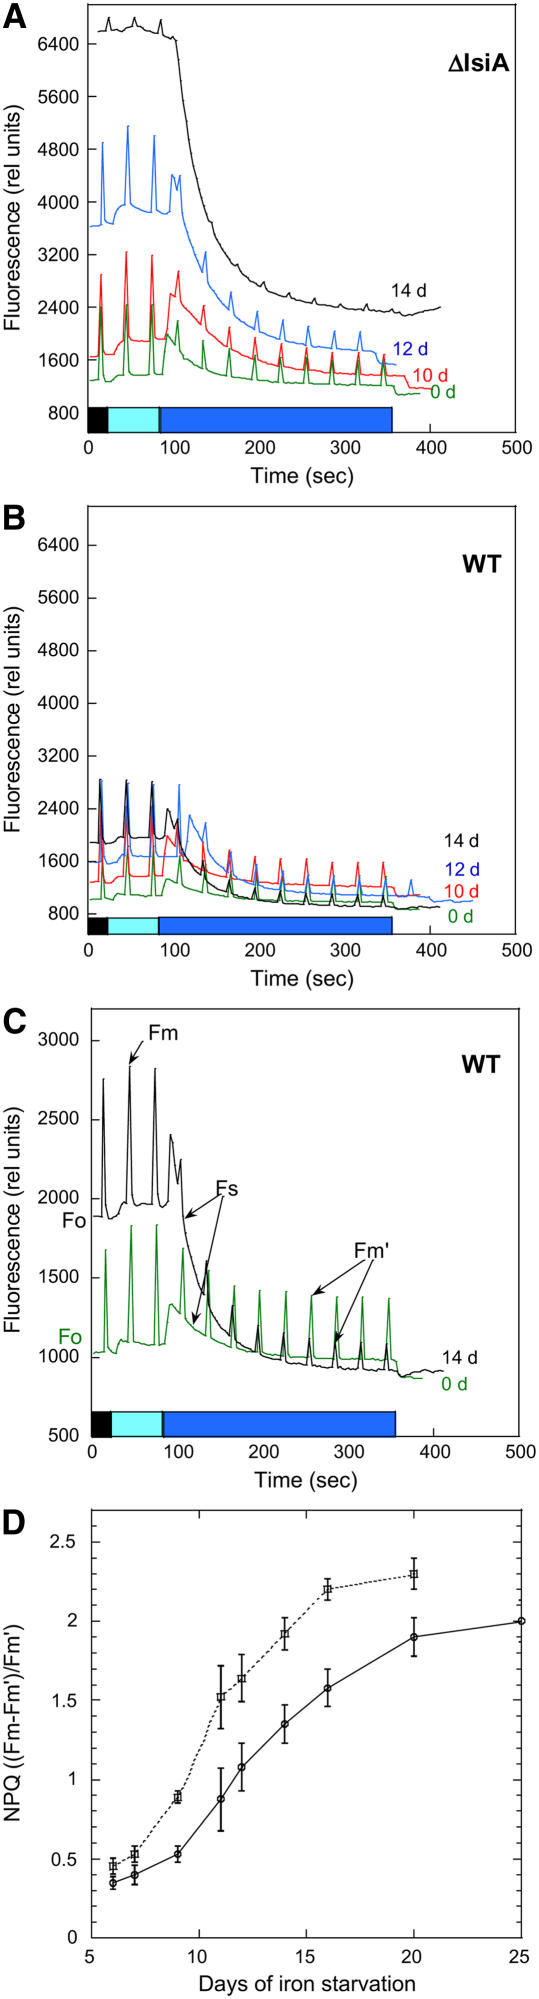
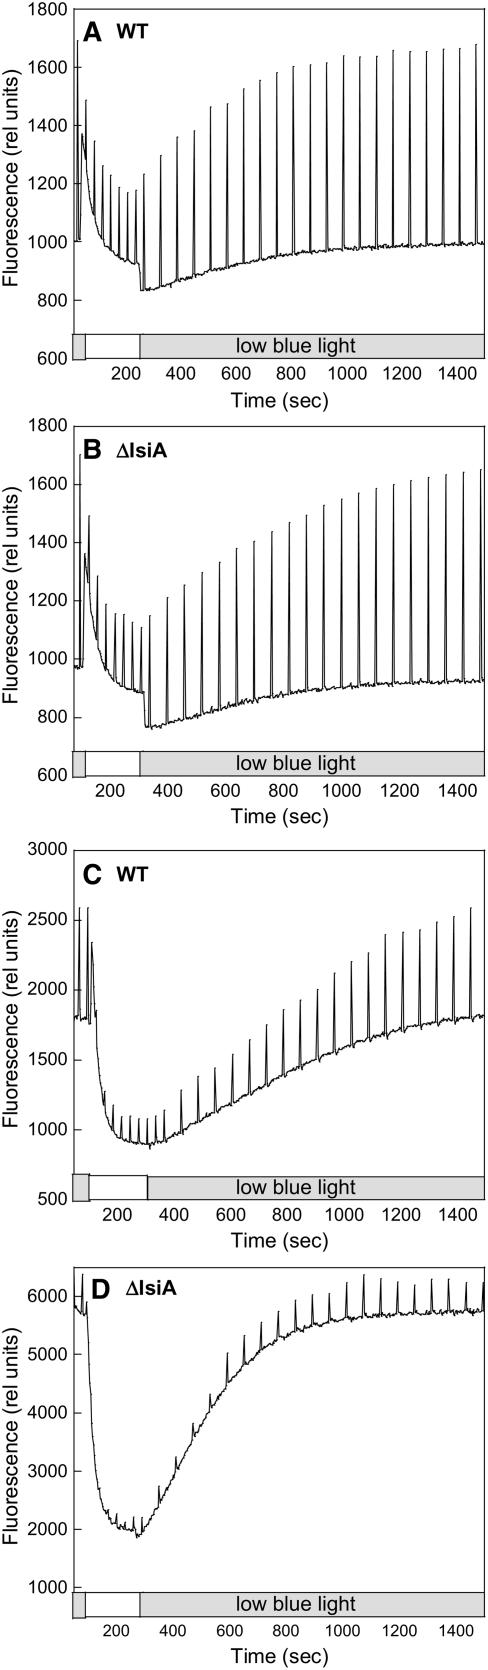
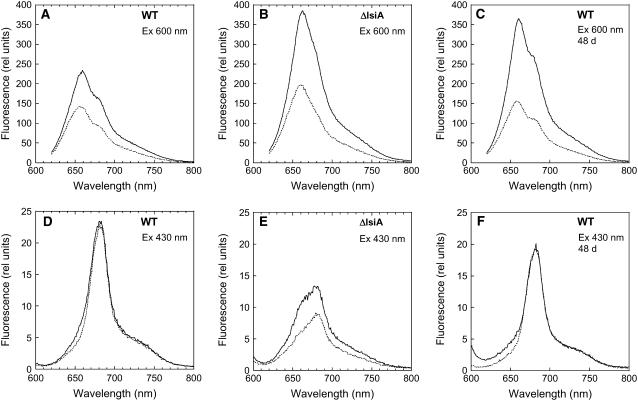
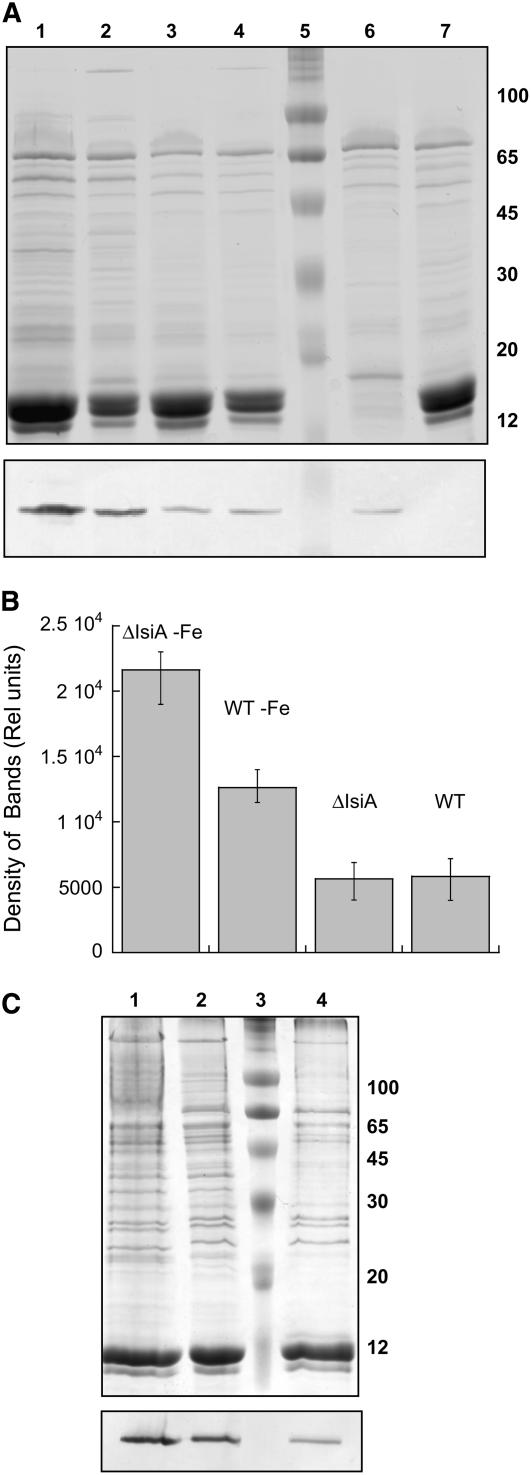
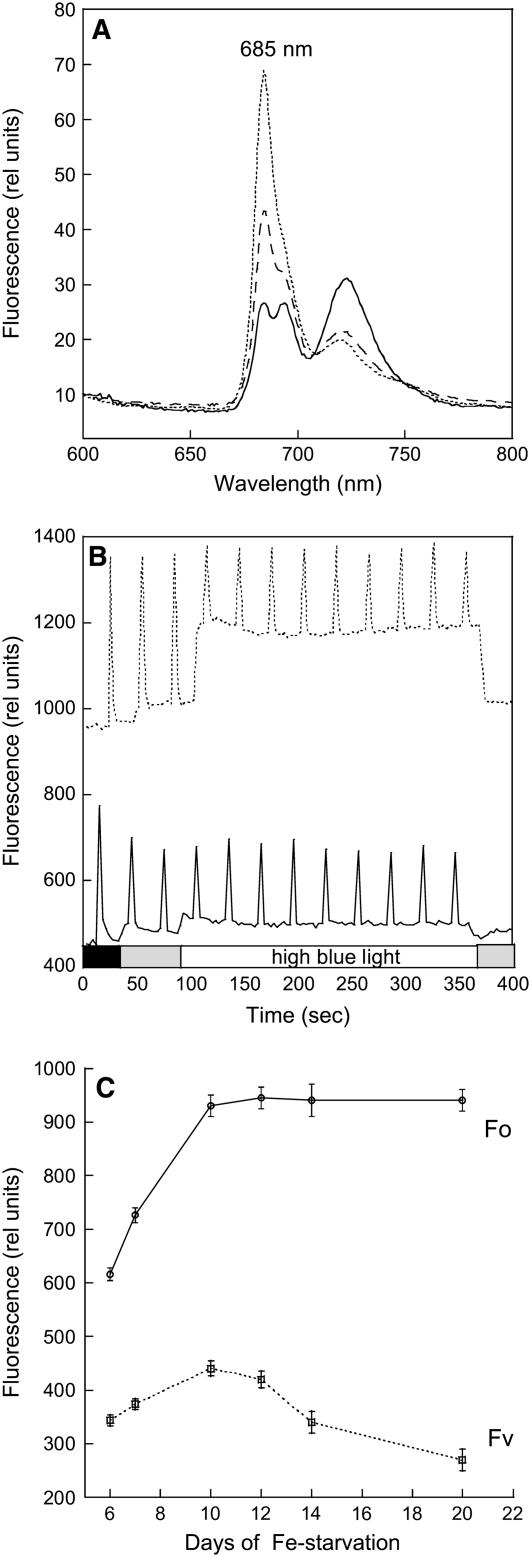
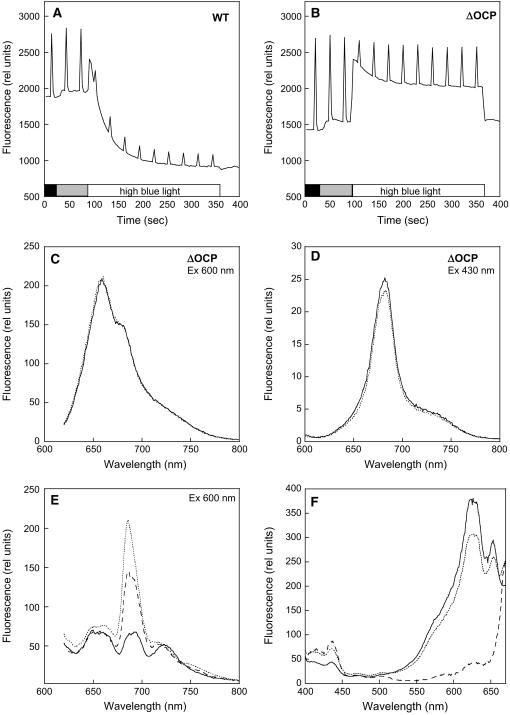
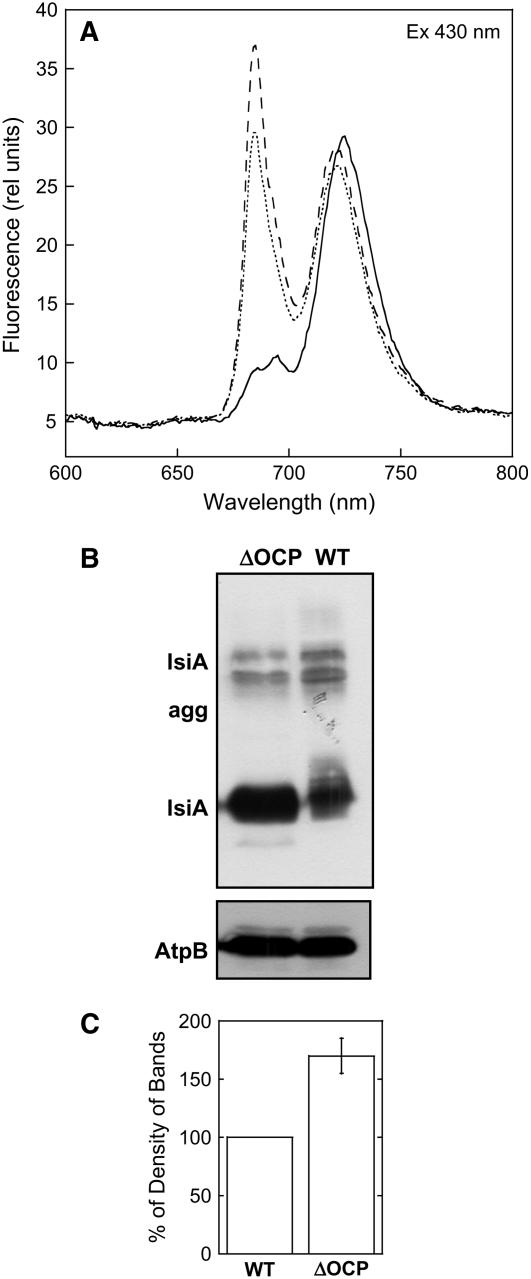
In response to iron deficiency, cyanobacteria synthesize the iron stress-induced chlorophyll binding protein IsiA. This protein protects cyanobacterial cells against iron stress. It has been proposed that the protective role of IsiA is related to a blue light-induced nonphotochemical fluorescence quenching (NPQ) mechanism. In iron-replete cyanobacterial cell cultures, strong blue light is known to induce a mechanism that dissipates excess absorbed energy in the phycobilisome, the extramembranal antenna of cyanobacteria. In this photoprotective mechanism, the soluble Orange Carotenoid Protein (OCP) plays an essential role. Here, we demonstrate that in iron-starved cells, blue light is unable to quench fluorescence in the absence of the phycobilisomes or the OCP. By contrast, the absence of IsiA does not affect the induction of fluorescence quenching or its recovery. We conclude that in cyanobacteria grown under iron starvation conditions, the blue light-induced nonphotochemical quenching involves the phycobilisome OCP-related energy dissipation mechanism and not IsiA. IsiA, however, does seem to protect the cells from the stress generated by iron starvation, initially by increasing the size of the photosystem I antenna. Subsequently, the IsiA converts the excess energy absorbed by the phycobilisomes into heat through a mechanism different from the dynamic and reversible light-induced NPQ processes.


Figures

Figure 1.
Figure 1.
Changes in Absorption Spectra and Chlorophyll Content Induced by Iron Starvation in Wild-Type, ΔOCP, and ΔIsiA Cells. (A) and (B) Absorption spectra of wild-type (A) and ΔOCP (B) cells grown in iron-containing medium (solid line) or in iron-depleted medium for 12 (small dashed line), 14 (dotted line), or 20 (large dashed line) d. (C) Absorption spectra of ΔIsiA cells grown in iron-containing medium (solid line) or in iron-free medium for 7 (large dashed line), 12 (small dashed line), or 14 (dotted line) d. The spectra were normalized at OD800. (D) Decrease of chlorophyll content in iron-starved wild-type (circles), ΔOCP (triangles), and ΔIsiA (squares) cells. The results are the average of seven independent experiments. Error bars show the maximum and minimum chlorophyll/OD800 values for each point. 100% of chlorophyll/OD800 = 7.5, corresponding to ∼5.8 μg chlorophyll/mL for a culture at OD800 = 0.78.
Figure 2.
Figure 2.
Changes in 77K Fluorescence Emission Spectra Induced by Iron Starvation in Wild-Type and ΔIsiA Mutant Cells. The 77K fluorescence spectra of wild-type ([A] and [C]) and ΔIsiA ([B] and [D]) cells grown in iron-containing medium (dotted line) or in iron-lacking medium for 7 (green), 10 (red), 12 (blue), and 14 (black) d. The excitation wavelength was 430 ([A] and [B]) or 600 nm ([C] and [D]). Each spectrum shown is the mean of four spectra. The 77K fluorescence spectra were normalized to the fluorescence emitted at 800 nm. The figure shows a representative iron starvation experiment; the experiments consistently showed similar fluorescence changes and kinetics. The cells were at 3 μg chlorophyll/mL.
Figure 3.
Figure 3.
Immunodetection of IsiA and CP47 in Membranes Isolated from Nonstarved and Starved Synechocystis Wild-Type and Mutant Cells. Coomassie blue–stained gel electrophoresis and immunoblot detection of IsiA and CP47 in the membrane fractions isolated from 10 d iron-starved ΔIsiA (lane 1) and wild-type (lane 2) cells and nonstarved wild-type cells (lane 3). The IsiA antibody also reacts with IsiA aggregates (IsiA agg). Lane 4, molecular mass markers (in kilodaltons). Each sample contained 1 μg of chlorophyll.
Figure 4.
Figure 4.
The 77K Excitation Fluorescence Spectra of Iron-Starved Wild-Type and ΔIsiA Cells. The 77K fluorescence emission spectra (Ex 600 nm) of 11 d iron-starved wild-type cells (solid line) and 11 d (dotted line) and 15 d (dashed line) iron-starved ΔIsiA cells (A). The 77K fluorescence excitation spectra for an emission at 725 (B), 698 (C), and 683 nm (D) of 11 d iron-starved wild-type cells (solid line) and 11 d (dotted line) and 15 d (dashed line) iron-starved ΔIsiA cells. The cells were at 2 μg chlorophyll/mL.
Figure 5.
Figure 5.
The 77K Fluorescence Emission Spectra of Iron-Starved Wild-Type and ΔIsiA MP Fractions. The 77K fluorescence spectra of nonstarved (dashed line), 12 d iron-starved wild-type (solid line; [A]), and iron-starved ΔIsiA (dotted line; [A]) cells, 15 d iron-starved wild-type cells (solid line; [C]), and iron-starved ΔIsiA (dotted line; [C]) cells and of the corresponding MP fractions ([B], wild-type; [D], ΔIsiA). The 77K fluorescence emission spectra were normalized to the fluorescence emitted at 800 nm. The cells were at 2 μg chlorophyll/mL.
Figure 6.
Figure 6.
Blue-Green Light–Induced Fluorescence Quenching in Iron-Starved Wild-Type and ΔisiA Cells. (A) to (C) The 0 d (green), 7 d (data not shown; similar to 0 d), 10 d (red), 12 d (blue), and 14 d (black) iron-starved ΔIsiA (A) and wild-type ([B] and [C]) cells (at 3 μg chlorophyll/mL) were dark-adapted and then illuminated successively with low-intensity blue-green light (400 to 550 nm, 80 μmol photons m−2 s−1) and high-intensity blue-green light (740 μmol photons m−2 s−1). Saturating pulses were applied to measure maximal fluorescence levels. Fm, maximal fluorescence under low intensities of blue light; Fm′, maximal fluorescence under high intensities of blue light; Fs, steady state fluorescence; Fo, minimal fluorescence (see [C]). In (C), the changes of fluorescence traces in 7 and 14 d iron-starved wild-type cells are shown with a different scale than (A) and (B) to clarify the differences in fluorescence quenching. (D) Increase of NPQ [(Fm − Fm′)/Fm′] during iron starvation of wild-type (circles and solid line) and ΔIsiA (squares and dotted line) cells. The graph is the average of four independent experiments. Error bars show the maximum and minimum NPQ values for each point.
Figure 7.
Figure 7.
Blue Light–Induced Quenching in Iron-Starved Wild-Type and ΔIsiA Cells Is Reversible without Protein Synthesis. Measurements of fluorescence yield by a PAM fluorometer in iron-starved wild-type ([A] and [C]) and ΔIsiA ([B] and [D]) cells for 7 ([A] and [B]) and 14 d ([C] and [D]) at 3 μg chlorophyll/mL illuminated successively with low-intensity blue-green light (400 to 550 nm; 80 μmol photons m−2 s−1) and high-intensity blue-green light (740 μmol photons m−2 s−1) and then again with dim blue-green light. Chloramphenicol was present during all experiments. The figure shows a representative experiment.
Figure 8.
Figure 8.
Room Temperature Fluorescence Spectra of Iron-Starved Unquenched and Quenched Cells. Room temperature fluorescence spectra of dark-adapted (solid line) 12 d iron-starved wild-type cells ([A] and [D]), 48 d iron-starved wild-type cells ([C] and [F]), and 12 d iron-starved ΔIsiA cells ([B] and [E]) and after 5 min of high-intensity blue-green light illumination (740 μmol photons m−2 s−1) (dotted line) at 3 μg chlorophyll/mL. Excitation was performed at 600 nm ([A] to [C]) and at 430 nm ([D] to [F]).
Figure 9.
Figure 9.
OCP Detection in Whole Cells and MP Fractions from Nonstarved and Starved Wild Type and Mutants. (A) Coomassie blue–stained gel electrophoresis and immunoblot detection (bottom panel) of OCP in 12 d iron-starved ΔIsiA (lane 1) and wild-type (lane 2) cells and nonstarved ΔIsiA (lane 3), wild-type (lane 4), PAL (lane 6), and ΔOCP (lane 7) cells. Lane 5 shows molecular mass markers. Each lane contained 1.5 μg of chlorophyll. (B) Comparative densitometry of OCP bands in nonstarved and iron-starved wild-type and ΔIsiA whole cells. The results represent the average of four independent experiments. Error bars show the maximum and minimum density of band values for each point. (C) Coomassie blue–stained gel electrophoresis and immunoblot detection (bottom panel) of the OCP in MP fractions isolated from 12 d iron-starved ΔIsiA (lane 1) and wild-type (lane 2) cells and nonstarved wild-type cells (lane 4). Lane 3 shows molecular mass markers. Each lane contained 1 μg of chlorophyll.
Figure 10.
Figure 10.
Fluorescence Changes in Iron-Starved PAL Cells. (A) The 77K fluorescence spectra of iron-containing (solid line) and iron-starved PAL cells for 7 (dashed line) and 10 d (dotted line). The excitation wavelength was 430 nm. (B) Dark-adapted iron-containing (solid line) and 12 d iron-starved PAL (dotted line) cells were illuminated successively with low-intensity blue-green light (400 to 550 nm; 80 μmol photons m−2 s−1) and high-intensity blue-green light (740 μmol photons m−2 s−1). (C) Changes in Fo and Fv in PAL cells during iron starvation. Fluorescence yield changes were detected in a PAM fluorometer. The cells were at 2 μg chlorophyll/mL. The results represent the average of three independent experiments. Error bars show the maximum and minimum chlorophyll/OD800 values for each point.
Figure 11.
Figure 11.
No Blue Light–Induced NPQ in Iron-Stressed ΔOCP Cells. (A) and (B) Fluorescence changes in iron-starved ΔOCP cells. Dark-adapted 14 d iron-starved wild-type (A) and ΔOCP (B) cells were illuminated successively with low-intensity blue-green light (400 to 550 nm; 80 μmol photons m−2 s−1) and high-intensity blue-green light (740 μmol photons m−2 s−1). Fluorescence yield changes were detected in a PAM fluorometer. The cells were at 3 μg chlorophyll/mL. (C) and (D) Room temperature fluorescence spectra of ΔOCP cells adapted to low light intensities of blue-green light (solid line) and after 5 min of high intensities of blue-green light illumination (dotted line). Excitation was done at 600 nm (C) and at 430 nm (D). (E) The 77K fluorescence emission spectra of iron-containing (solid line), 14 d iron-starved (dotted line) wild-type cells, and 14 d iron-starved ΔOCP cells (dashed line). Excitation was done at 600 nm. (F) The 77K fluorescence excitation spectra of 14 d iron-starved wild-type (solid line) and ΔOCP (dotted line) and PAL cells (dashed line). Emission was monitored at 685 nm. The cells were at 3 μg chlorophyll/mL.
Figure 12.
Figure 12.
IsiA Presence in Iron-Starved ΔOCP Cells. (A) The 77K fluorescence emission spectra of iron-containing (solid line) and 14 d iron-starved (dotted line) wild-type cells and of 14 d iron-starved ΔOCP cells (dashed line). Excitation was done at 430 nm. The cells were at 3 μg chlorophyll/mL. (B) Immunoblot detection of IsiA of the membrane fraction isolated from 13 d iron-starved ΔOCP (lane 1) and wild-type (lane 2) cells. An antibody against the subunit AtpB of the ATP synthase was used as internal standard (bottom panel). Each sample contained 2 μg of chlorophyll. (C) Comparative densitometry of IsiA levels in iron-starved wild-type and ΔOCP thylakoids. The results represent the average of three independent experiments. Each error bar shows the maximum and minimum density of band values for each point.

Similar articles

Cited by

References

    1. Adamska, I. (1997). Elips: Light-induced stress proteins. Physiol. Plant 100 794–805.
    1. Adamska, I. (2001). The Elip family of stress proteins in the thylakoids membranes of pro- and eukaryota. In Advances in Photosynthesis and Respiration-Regulation of Photosynthesis, Vol. 11, E.M. Aro and B. Andersson, eds (Dordrecht, The Netherlands: Kluwer Academic Publishers), pp. 487–505.
    1. Adir, N. (2005). Elucidation of the molecular structures of components of the phycobilisome: Reconstructing a giant. Photosynth. Res. 85 15–32. - PubMed
    1. Ajlani, G., and Vernotte, C. (1998). Construction and characterization of a phycobiliprotein-less mutant of Synechocystis sp. PCC 6803. Plant Mol. Biol. 37 577–580. - PubMed
    1. Ajlani, G., Vernotte, C., DiMagno, L., and Haselkorn, R. (1995). Phycobilisome core mutants of Synechocystis PCC 6803. Biochim. Biophys. Acta 1231 189–196.

Publication types

MeSH terms

Substances

Associated data

LinkOut - more resources