. 2007 May;51(5):1627-32.
doi: 10.1128/AAC.01192-06. Epub 2007 Feb 16.

Role of acidic pH in the susceptibility of intraphagocytic methicillin-resistant Staphylococcus aureus strains to meropenem and cloxacillin

Affiliations

Role of acidic pH in the susceptibility of intraphagocytic methicillin-resistant Staphylococcus aureus strains to meropenem and cloxacillin

Sandrine Lemaire et al. Antimicrob Agents Chemother. 2007 May.

Abstract

Early studies showed that methicillin-resistant Staphylococcus aureus (MRSA) strains are susceptible to beta-lactams when they are exposed to pH < or = 5.5 in broth. Because S. aureus survives in the phagolysosomes of macrophages, where the pH may be acidic, we have examined the susceptibility of MRSA ATCC 33591 phagocytized by human THP-1 macrophages to meropenem (MEM) and cloxacillin (CLX). Using a pharmacodynamic model assessing key pharmacological (50% effective concentration and maximal efficacy) and microbiological (static concentration) descriptors of antibiotic activity, we show that intraphagocytic MRSA strains are as sensitive to MEM and CLX as methicillin-susceptible S. aureus (MSSA; ATCC 25923). This observation was replicated in broth if the pH was brought to 5.5 and was confirmed with clinical strains. Electron microscopy showed that both the MRSA and the MSSA strains localized and multiplied in membrane-bounded structures (phagolysosomes) in the absence of beta-lactams. Incubation of the infected macrophages with ammonium chloride (to raise the phagolysosomal pH) made MRSA insensitive to MEM and CLX. No difference was seen in mec, mecA, mecI, mecR1, femA, and femB expression (reversed transcription-PCR) or in PBP 2a content (immunodetection) in MRSA grown in broth at pH 5.5 compared with that in MRSA grown in broth at 7.4. The level of [(14)C]benzylpenicillin binding to cell walls prepared from a non-beta-lactamase-producing MRSA clinical isolate was two times lower than that to cell walls prepared from MSSA ATCC 25923 at pH 7.4, but the levels increased to similar values for both strains at pH 5.5. These data suggest that the restoration of susceptibility of intraphagocytic of MRSA to MEM and CLX is due to the acidic pH prevailing in phagolysosomes and is mediated by an enhanced binding to penicillin-binding proteins.


Figures

FIG. 1.
FIG. 1.
Concentration killing effects of meropenem (squares; left panel) and cloxacillin (circles; right panel) toward MSSA strain ATCC 25923 (open symbols and dotted line) and MRSA strain ATCC 33591 (closed symbols and continuous line) after phagocytosis by THP-1 macrophages. Cells were incubated with the antibiotics for 24 h at the concentrations (total drug) indicated on the abscissa. All values are the means ± standard deviations of three independent determinations (standard deviation bars that are not visible are smaller than the size of the symbols). The arrows along the abscissa point to the MIC of the organisms determined in broth at pH 7.4 (open arrows, MSSA strain ATCC 25923; closed arrows, MRSA ATCC 33591).
FIG. 2.
FIG. 2.
Morphology of S. aureus in THP-1 macrophages. Cells were allowed to phagocytize the bacteria for 1 h and thereafter were incubated for 24 h (in the presence of gentamicin at 0.5× MIC) to prevent the extracellular growth of bacteria and ensuing cell death due to acidification of the medium). (A and B) Arrows point to the membrane surrounding the bacterial profiles; (C) evidence of multiplication of MRSA in a membrane-bounded structure. Bars, 0.5 μm.
FIG. 3.
FIG. 3.
Influence of pH on the MICs of meropenem and cloxacillin for MRSA ATCC 25923 and MRSA ATCC 33591 as determined in broth. Each datum point corresponds to three determinations with identical results. Symbols for one antibiotic that are not visible are overlapped by the corresponding symbols of the other antibiotic.
FIG. 4.
FIG. 4.
Concentration killing effects of meropenem (squares; left panels) and cloxacillin (circles; right panels) toward MSSA strain ATCC 25923 (upper panels) and MRSA strain ATCC 33591 (lower panels) in broth at an initial pH of 7.4 (open symbols and dotted line) or 5.5 (closed symbols and continuous line). The bacteria were incubated with the antibiotics for 24 h at the concentrations (total drug) indicated on the abscissa. All values are the means ± standard deviations of three independent determinations (standard deviation bars that are not visible are smaller than the size of the symbols).
FIG. 5.
FIG. 5.
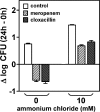
Influence of ammonium chloride on the intracellular growth of methicillin-resistant S. aureus (ATCC 33591) and on the activities of meropenem and cloxacillin in THP-1 macrophages. Ammonium chloride was added after phagocytosis simultaneously with the antibiotics, and the cells were further incubated for 24 h before collection. Open bars, control (cells incubated for 24 h with gentamicin at 0.5× MIC to prevent the extracellular growth of bacteria and the ensuing cell death due to acidification of the medium); striped white bars, meropenem (50 mg/liter [total drug; corresponding to the human total drug Cmax]); striped gray bars, cloxacillin (8 mg/liter [total drug; corresponding to the human total drug Cmax). All values are the means ± standard deviations of three independent determinations.
FIG. 6.
FIG. 6.
Binding of [14C]benzylpenicillin to MSSA strain ATCC 25923 (open and light gray bars) and MRSA strain 459 (β-lactamase negative; dark gray and closed bars) after 5 h of growth in broth at an initial pH of 7.4 (open or dark gray bars) or 5.5 (light gray or closed bars). For each culture condition, binding was made at pH 7.4 or 5.5, as indicated on the abscissa. All values are the means ± standard deviations of three independent determinations (standard deviation bars that are not visible are smaller than the size of the frame of the corresponding bar). Statistical analysis (ANOVA), bars with different letters are significantly different from all others (P < 0.01).

Similar articles

Cited by

References

    1. Barcia-Macay, M., C. Seral, M. P. Mingeot-Leclercq, P. M. Tulkens, and F. Van Bambeke. 2006. Pharmacodynamic evaluation of the intracellular activity of antibiotics against Staphylococcus aureus in a model of THP-1 macrophages. Antimicrob. Agents Chemother. 50841-851. - PMC - PubMed
    1. Chambers, H. F., and C. Miick. 1992. Characterization of penicillin-binding protein 2 of Staphylococcus aureus: deacylation reaction and identification of two penicillin-binding peptides. Antimicrob. Agents Chemother. 36656-661. - PMC - PubMed
    1. Dikstein, S., and A. Zlotogorski. 1994. Measurement of skin pH. Acta Dermatol. Venereol. Suppl. (Stockholm) 18518-20. - PubMed
    1. Foster, T. J. 2005. Immune evasion by staphylococci. Nat. Rev. Microbiol. 3948-958. - PubMed
    1. Fuda, C., D. Hesek, M. Lee, W. Heilmayer, R. Novak, S. B. Vakulenko, and S. Mobashery. 2006. Mechanistic basis for the action of new cephalosporin antibiotics effective against methicillin- and vancomycin-resistant Staphylococcus aureus. J. Biol. Chem. 28110035-10041. - PubMed

Publication types

LinkOut - more resources